
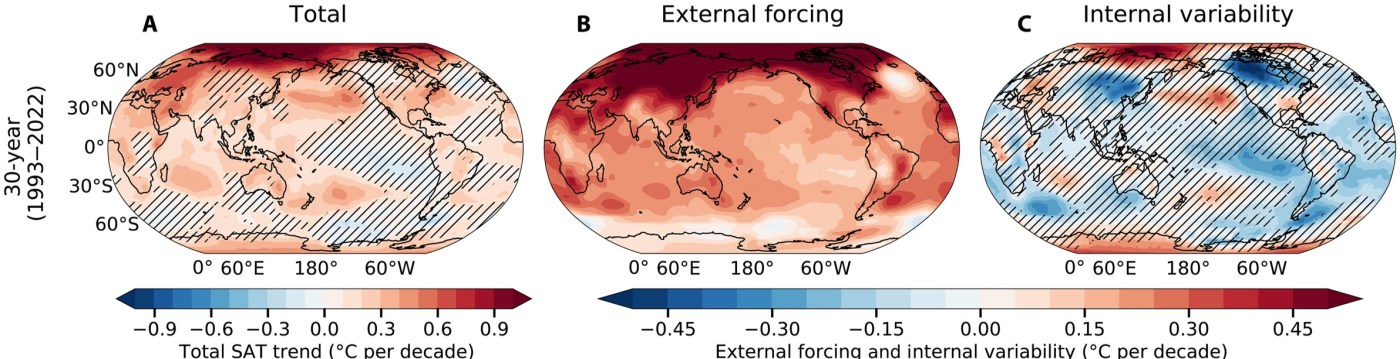
Fig. 2 from Aru et al. (2026): Partitioning of observed SAT trend patterns into external forcing and internal variability. (A) Total, (B) external forcing, and (C) internal variability observed SAT trend patterns for the most recent (D to F) 30-year (1993–2022) periods, respectively, by regressing observed local anomalies against the 1850–2022 MMLE GSAT time series. Hatched regions denote statistically insignificant trends at the 95% confidence level, as determined by the nonparametric Mann-Kendall trend test.
This blog post and the “Deep Dive” podcast, created by Google Notebook, are based on “Observed fingerprint of global warming exposes model biases in regional climate attribution” by Aru et al. (2026).
This research article introduces the Observed Linear Pattern Scaling (OBS-LPS) framework, a diagnostic tool designed to separate externally forced global warming from internal climate variability in historical temperature data. By isolating these components, the authors identify significant model biases, revealing that current climate simulations often struggle to accurately replicate regional warming and cooling patterns seen in observations. The study highlights “contested regions,” such as the Arctic and Southern Ocean, where discrepancies between models and real-world data undermine the reliability of local climate attributions. Furthermore, the authors establish a new emergence timescale metric to determine how long it takes for a human-driven climate signal to become clearly visible against the background noise of natural fluctuations. Ultimately, this work provides a more rigorous basis for regional climate projections and helps resolve long-standing puzzles regarding why certain areas have not warmed as predicted by standard models.
An Arctic fisherman watches the sea ice vanish, yet notices the air isn’t warming quite as fast as the nightly news warned. Meanwhile, a resident of the Indo-Pacific feels the “permanent” shift into a new climate regime decades before the maps said they would. These aren’t just anecdotes of weather-related luck; they are the front lines of a growing crisis in climate science: the “Regional Reality” gap.
While the “unequivocal” fact of global warming is settled science, our ability to predict what happens in your specific zip code is increasingly contested. We have mastered the global average, but we are struggling with the local specificities. A landmark study by Aru et al. (2026) has finally provided a lens to see through this fog. Using a new diagnostic framework called Observed Linear Pattern Scaling (OBS-LPS), researchers are exposing the “blind spots” in our most advanced predictive tools and revealing a planet where warming is a spatially inhomogeneous beast.
1. The “Fingerprint” isn’t a Smudge—It’s a Detailed Map
For years, attributing a local heatwave or a cooling trend to human activity has been like trying to isolate a single whisper in a packed stadium. Standard methods often mistook long-term natural cycles for human impact, or vice-versa.
The OBS-LPS method changes the game by using a “Global Warming Index” (the MMLE GSAT) as a high-signal regressor. This allows scientists to surgically “partition” what we see into two piles: internal variability (nature’s chaotic noise) and externally forced signals (the fingerprint of human-driven warming). This isn’t just a win for academic clarity; it is a revolution for climate jurisprudence. As cities and nations head to court to sue for climate damages, the ability to prove a “forced” signal versus “natural noise” is the difference between a multi-billion dollar settlement and a dismissed case.
“Disentangling externally forced signals from internal variability in observed surface air temperature (SAT) is essential for reliable regional climate detection and attribution… The resulting observed fingerprint reveals spatially inhomogeneous warming, with strong amplification over the Northern Hemisphere land and high-latitude oceans.”
2. The Arctic is Warming, but Models are “Over-Eager”
The Arctic is the ultimate “canary in the coal mine,” but the Aru et al. study found something counter-intuitive. While the region is warming rapidly, climate models are actually overestimating the pace of human-forced warming there.
Over the last two decades, the pace of Arctic warming actually took a breather. The OBS-LPS analysis shows that natural internal variability acted as a temporary “brake,” slowing down the inevitable heat. Because our current models didn’t account for this specific natural cooling excursion, they projected an Arctic that was far hotter than the reality on the ground, leading to a mismatch between simulation and the actual experience of those living at the pole.
3. The North Atlantic “Warming Hole” is Shifting Regimes
In the middle of a warming world, a patch of the North Atlantic has stubbornly remained cool—a phenomenon known as the North Atlantic Warming Hole (NAWH). But this region is currently a “battlefield” of shifting regimes.
The study reveals a dramatic “sign flip”: internal variability recently spiked, reversing the long-term cooling trend and turning it into a warming one. This makes the North Atlantic a nightmare for policymakers because it suffers from extreme “endpoint dependence.” If you start your data set just five years earlier or later, the entire narrative—whether the region is cooling or warming—flips. This suggests a potential “regime transition” that models are still struggling to navigate.
4. The Southern Ocean’s Cooling Paradox
How can the Southeast Pacific (SEP) and Southern Ocean be cooling while the planet burns? Critics of climate action often point to these blue patches of cooling as “proof” that the models are broken.
The reality is more nuanced. The study confirms that beneath the cooling waves of the Southern Ocean, there is a “modest yet consistent” human-forced warming signal. Human activity is pushing the temperature up, but for now, natural internal variability is the “dominant driver,” temporarily masking our impact with a powerful cooling excursion.
“These findings highlight the dominant role of observed internal variability in shaping regional SAT patterns and raises concerns about biases in climate models when simulating regional internal variability.”
5. The “Emergence” Clock is Ticking (at Different Speeds)
The researchers introduced the Emergence Timescale—a metric that calculates how many years of data you need before the human “signal” becomes permanently visible above the natural “noise.” The clock is ticking, but not at the same speed:
- Rapid Emergence (10-15 years): The Arctic, the Indo-Pacific, and the Tropical North Atlantic. Here, the “new normal” has already arrived.
- Moderate Emergence (30-45 years): The Northern and Tropical Eastern Pacific.
- Undetectable (73+ years): Parts of the Southern Ocean and the NAWH. In these zones, nature is still louder than man.
The Systematic Skew: The most disturbing find is a major model failure. Climate models are producing a “skewed” depiction of reality: they show delayed emergence in the Arctic (predicting the signal will show up later than it actually has) while underestimating timescales in the tropics (predicting the signal will show up sooner than it actually does). Our tools are lagging where the fire is brightest and jumping the gun where it is still smoldering.
6. The ECS Problem: Why Simpler Models Might Be Smarter
The study also wades into the debate over Equilibrium Climate Sensitivity (ECS)—the measure of how hot the Earth gets when CO2 doubles.
The data shows that “High-ECS” models—the “hot” models that predict the most aggressive warming—actually have a lower correlation with real-world regional patterns. Conversely, “Lower-ECS” models were significantly more accurate at matching observed regional data.
This leads to a high-stakes reflection: if we continue to rely on “hot” models for local infrastructure, we risk over-engineering our world. We might spend billions on sea walls and heat-mitigation grids that are designed for a regional reality that isn’t coming, wasting precious resources that could have been used for more accurate, localized threats.
7. Conclusion: Beyond the Global Average
Global warming is not a uniform blanket; it is a jagged, inconsistent transformation of the only home we have. The OBS-LPS method has exposed the “blind spots” where our most expensive models are failing to map the local terrain.
As we move beyond the global average, we are forced to confront a difficult question: how do we plan for a future when our best predictive tools are systematically skewed? Recognizing these “contested realities” is the first step toward a climate strategy that is actually grounded in what we see out the window, rather than just what we see on a screen.
Aru, H., D. Olonscheck, J. Marotzke, & C. Li, Observed fingerprint of global warming exposes model biases in regional climate attribution. Sci. Adv. 12, eaed1506 (2026). https://doi.org/10.1126/sciadv.aed1506


Leave a comment