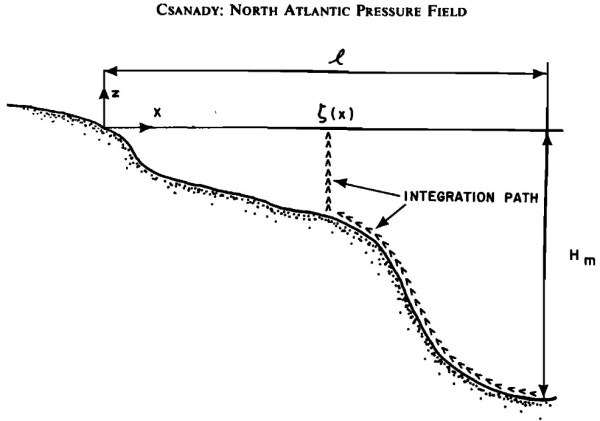
Figure 3 from Csanady (1979). Schematic cross section along a western boundary (x increasing eastward). The arrows identify the paths of density integration used to compute coastal steric setup. This blog post and the “Deep Dive” podcast, created by Google Notebook, are based on “Steric-Setup Effects on US East Coast Sea-Level Change” by Steinberg et... Continue Reading →
Assessment of 17 Global Ocean Reanalyses Indicates a Widespread Reduction in the AMOC Heat Transport Since the Early 1990s
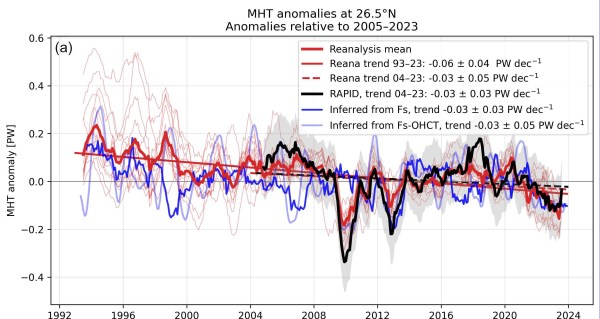
Figure 11a from Winkelbauer et al. (2026). MHT anomalies at 26.5°N. Thin red curves show individual reanalysis products and the thick red curve denotes the ensemble mean. Thick black curves show RAPID observations. The blue curve in the upper panel shows the inferred MHT estimate, calculated as the mean over ERA5, JRA3Q and MERRA2. the... Continue Reading →
North Atlantic Planktons Are Steering European Weather and Crop Yields
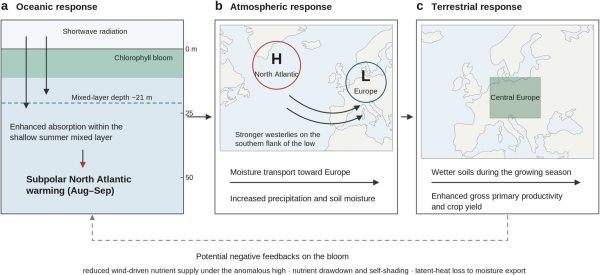
Figure 7 from Yang et al. (2026). The chlorophyll–climate–ecosystem teleconnection as a sequential ocean–atmosphere–land process. a Oceanic response: a North Atlantic chlorophyll bloom is associated with increased bio-optical absorption of shortwave radiation within the shallow late-summer mixed layer, potentially contributing to mixed-layer heating and sea-surface warming; the dashed line marks the climatological August–September mixed-layer depth... Continue Reading →