
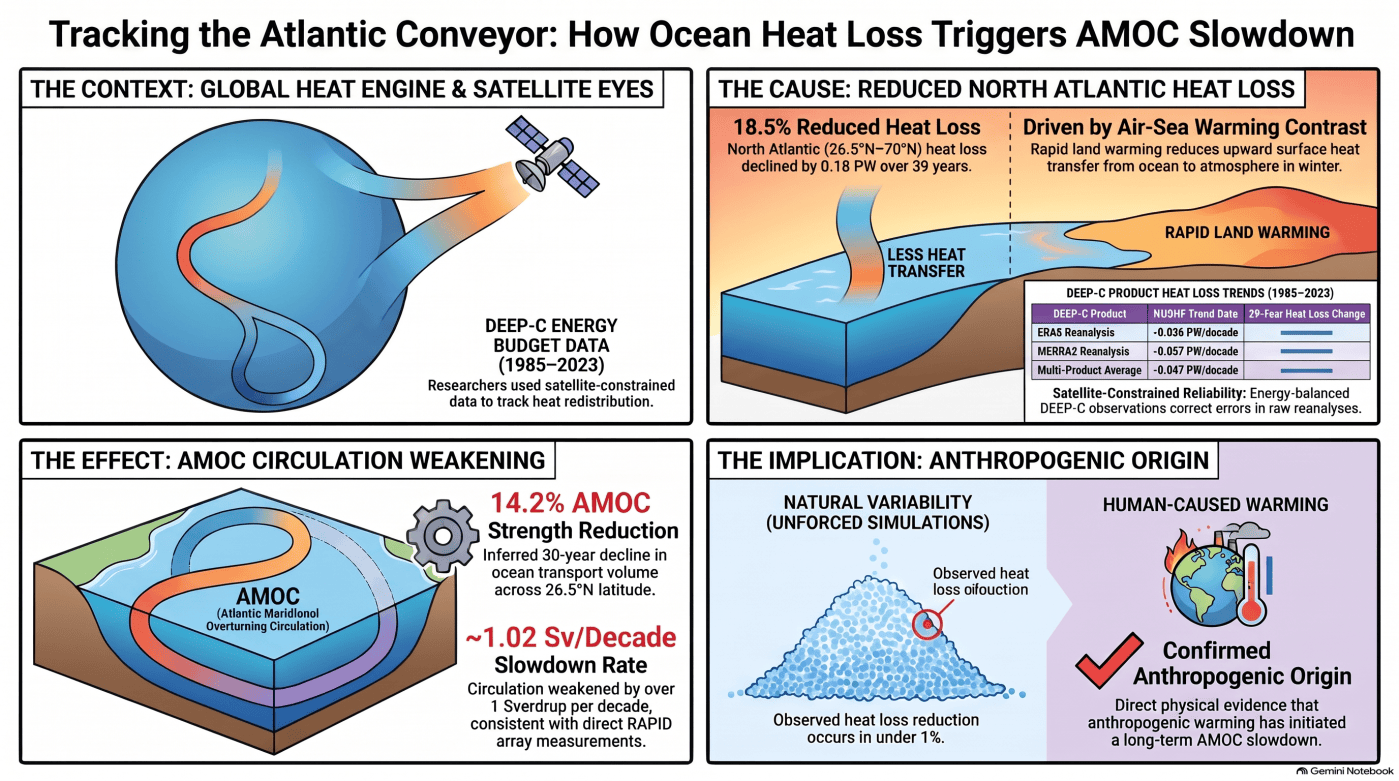
This blog post and the “Deep Dive” podcast, created by Google Notebook, are based on “Evidence the ocean is losing less heat in the northern Atlantic and the AMOC has started to slowly weaken” by Bell et al. (2026).
This preprint article (Bell et al., 2026) investigates the behavior of the Atlantic Meridional Overturning Circulation (AMOC) by analyzing net upward surface heat fluxes (NUSHFs) across the northern Atlantic Ocean. By utilizing satellite-based DEEP-C estimates alongside CMIP6 climate models, the authors demonstrate that a declining ocean heat loss between 1985 and 2023 serves as the fundamental mechanism for a gradual weakening of the AMOC. Because direct observational records are too short and traditional proxies are often unreliable, this heat-flux-based approach provides a more robust method for detecting and quantifying long-term climate change impacts. Ultimately, the findings indicate that greenhouse gas forcing has driven a statistically significant reduction in surface heat loss, confirming that the AMOC has already begun a slow decline.
This conclusion is in stark contrast with Terhaar et al. (2025), which analyzed air-sea heat fluxes and concluded there was no evidence of an AMOC decline since the 1960s. The authors argue that earlier studies finding no decline relied on heat fluxes taken directly from atmospheric reanalyses, which are not observationally constrained by satellite energy budgets and can contain artificial trends. By using the satellite-constrained DEEP-C dataset, the authors show an 18.5% reduction in ocean heat loss in the northern Atlantic between 1985 and 2023, inferring that the AMOC has in fact begun a slow weakening trend (~14.2% over 30 years)
1. Introduction: The Ocean Conveyor Belt at a Crossroads
The Atlantic Meridional Overturning Circulation (AMOC) serves as Europe’s primary thermal regulator. By transporting warm, shallow waters from the tropics toward the subpolar North Atlantic and returning cold, dense water back southward in the abyss, this massive oceanic conveyor belt sheds colossal amounts of ocean heat into the atmosphere. This continuous thermal exchange is what keeps Western and Northern Europe significantly warmer than comparable latitudes in North America and Asia.
For decades, climate models have warned that rising global temperatures would eventually weaken this circulation system. Yet, confirming whether a long-term, human-driven slowdown has already begun in the real world has proven notoriously difficult. Direct oceanographic measurements across the full Atlantic basin are relatively recent, while historical surface records are heavily corrupted by short-term decadal noise and internal climate variability.
Now, a study by Michael Bell et al. (2026) offers a decisive breakthrough. Rather than relying on indirect thermal proxies or noisy short-term arrays, researchers tracked the net upward surface heat flux (NUSHF) across the northern Atlantic using satellite-constrained energy budgets from the DEEP-C dataset. Their findings deliver direct physical evidence that the Atlantic Ocean is shedding significantly less heat into the atmosphere than it did four decades ago—confirming that the core thermal engine of the AMOC has indeed begun to slowly weaken under anthropogenic climate forcing.
2. Takeaway 1: North Atlantic Ocean Heat Loss Has Plummeted by Nearly 18.5% Since 1985
Using the observationally constrained DEEP-C dataset spanning 39 years from 1985 to 2023, scientists evaluated net surface heat fluxes across the northern Atlantic domain bounded between 26.5 and 70. The analysis revealed a clear, sustained reduction in heat released from the ocean into the overlying atmosphere. Over this 39-year window, total ocean heat loss dropped from an initial rate of 0.986 Petawatts (PW) by 0.047 PW per decade. Cumulatively, this represents an absolute decrease of 0.18 PW—a staggering reduction of 18.5 10.3 (within a 95% confidence interval).
To appreciate how localized and intense this signal is, consider the numbers per unit area. Ocean heat loss across this North Atlantic region has dropped at a rate of 2.15 per decade. By comparison, Earth’s global mean top-of-atmosphere radiative imbalance—the net energy accumulated by the entire planet due to greenhouse warming—has increased by 0.45 per decade over the last 20 years. The localized signal in the North Atlantic is nearly five times larger than the global average trend.
This localized anomaly is physically tied to differential warming rates: because the North American landmass warms much faster than the adjacent North Atlantic Ocean, the thermal contrast between winter air masses and the sea surface has shrunk dramatically. This dropping rate of ocean heat release is critical because heat shed from the ocean into the cold northern air is the fundamental physical driver that cools surface waters, making them dense enough to sink and pull the entire global conveyor belt forward.
3. Takeaway 2: Heat Loss Is the “Smoking Gun” Proxy Climate Scientists Have Been Missing
Prior attempts to reconstruct historical AMOC trends relied heavily on surface proxies such as Sea Surface Temperature (SST) “fingerprints,” subsurface salinity, or sea level variations. However, these indicators often yielded conflicting conclusions. SST fingerprints, for instance, can be distorted by external atmospheric aerosol forcing and local surface winds, obscuring the underlying circulation signal. Meanwhile, direct oceanographic measurement arrays—such as the RAPID array at 26.5—have only been active since 2004, a duration far too short to separate a permanent multi-decadal decline from background natural variability.
Scientists also attempted to use surface heat fluxes extracted directly from atmospheric reanalyses, but raw reanalyses are unconstrained by energy conservation. They suffer from artificial atmospheric moisture additions and observing system shifts, producing spurious, positive heat flux trends that wildly contradict actual ocean heat content observations (producing global surface flux imbalances as large as 10).
The breakthrough in the study by Bell et al. comes from utilizing the DEEP-C satellite-constrained energy budget method. DEEP-C combines top-of-atmosphere radiation measured by satellites (such as ERBE and CERES) with mass-corrected atmospheric energy flux divergence derived from reanalyses. In plain language, this approach tracks the net horizontal movement of heat through the atmospheric column across basin boundaries, ensuring that any energy entering or leaving the system is fully accounted for using constrained temperature, moisture, and wind fields.
Because long-term AMOC weakening under global warming is driven at its root by reductions in surface buoyancy loss, tracking surface heat fluxes targets the circulation’s physical engine directly. As the authors emphasize:
“Our study directly targets the change in surface heat loss, because it is the fundamental mechanism for the long-term AMOC weakening seen in climate change projections.”
4. Takeaway 3: The Atlantic Conveyor Has Already Weakened by Roughly 14% Over 30 Years
To translate observed surface heat loss into volumetric ocean transport, researchers analyzed state-of-the-art CMIP6 climate simulations. The models reveal a robust linear correlation—with regression slopes between 18.519.5—between the average surface heat loss north of 26.5 over a preceding 10-year window and the strength of the AMOC volume transport at 26.5.
In physical oceanography, volume transport is measured in Sverdrups (), where 1 equals one million cubic meters of water per second—a volume roughly equivalent to the combined flow of all the world’s rivers.
Applying this physical correlation to the DEEP-C dataset yields explicit estimates of AMOC slowdown:
- Over the last 40 years, the inferred annual AMOC trend at 26.5 shows a decline rate of -0.890.49.
- Over the last 30 years, evaluating heat loss averaged over preceding 10-year running windows indicates an inferred slowdown rate of -1.02 0.46, corresponding to a cumulative transport decline of 14.2 13.9.
- When accounting for both the DEEP-C observational trend uncertainty and the regression model’s residual variance ( = 0.456), the total combined 95% confidence interval for this 30-year trend is 1.00.
Why does a 10-year running average provide a clearer signal than annual data? Short-term AMOC fluctuations (lasting less than 2 to 3 years) are heavily dominated by superficial wind-stress noise. Multi-decadal circulation trends, by contrast, are driven by surface buoyancy (heat and freshwater) losses in the high latitudes. Averaging heat fluxes over a 10-year window effectively filters out wind noise, exposing the true buoyancy-forced circulation slowdown.
Crucially, this inferred historical slowdown rate aligns remarkably well with direct physical measurements from the RAPID array, which recorded an AMOC transport decline of approximately -0.89 between 2004 and 2023.
5. Takeaway 4: This Isn’t Natural Noise—It Is a Direct Fingerprint of Human-Driven Climate Change
A fundamental challenge in climate science is distinguishing human-driven trends from unforced, natural climate oscillations. To resolve this, researchers compared the satellite-constrained DEEP-C trends against hundreds of climate model runs from the CMIP6 archive, including pre-industrial control (piControl) simulations free from human greenhouse gas forcing, historical runs, and future high-emission scenarios (ssp245 and ssp585).
The statistical separation between natural variability and real-world observations is overwhelming:
- Out of 324 pre-industrial control run 40-year periods, fewer than 1% exhibited a heat loss drop as steep as the observed DEEP-C trend.
- Remarkably, out of those 324 unforced pre-industrial control periods, only a single 40-year period produced a trend more negative than the DEEP-C ERA5 product, and zero periods matched the steep negative trends recorded by the DEEP-C JRA55 and MERRA2 products.
Because two out of three satellite-constrained reanalysis products show zero statistical precedent in unforced natural control runs, the conclusion is clear: the observed multi-decadal drop in North Atlantic surface heat shedding—and the corresponding AMOC slowdown—is not natural background noise. It is an unequivocal fingerprint of anthropogenic climate change.
6. Takeaway 5: The “Warm Land, Cold Air” Mechanism Off the Canadian Coast
The study highlights the specific physical atmospheric mechanism driving this ocean heat loss drop. As greenhouse gases accumulate in the atmosphere, continental landmasses warm significantly faster and more intensely than open ocean waters.
This land-ocean warming contrast is geographically concentrated off the eastern coast of Canada. Historically during winter, bitter continental air blew off North America and moved over the warmer waters of the North Atlantic, driving massive transfers of heat from the ocean into the air column. Under global warming, however, the winter air blowing off the continent has warmed at a faster rate than the offshore sea surface.
This differential warming reduces the air-sea temperature gradient. With a smaller temperature gap between the air and the sea, the ocean’s physical capacity to shed its heat upward into the atmosphere is choked off.
Interestingly, standard CMIP6 climate models struggle to capture this exact geographical detail. Because their horizontal resolution is too coarse, traditional models fail to accurately simulate local bathymetric flow steering and intense localized air-sea heat transfers. This explains why standard climate projections show wide variations in the location of the North Atlantic “warming hole,” whereas the satellite-constrained DEEP-C data reveals a sharply localized real-world signal focused directly off the Canadian coast.
7. Conclusion: What This Means for Our Warming World
The long-standing debate over whether the Atlantic Ocean’s circulation engine has begun to slow under modern climate change is rapidly closing. By shifting focus from noisy sea surface temperature proxies to satellite-constrained atmospheric energy budgets, scientists have isolated the core driver of overturning circulation: net upward surface heat loss. The observational record reveals a sustained, four-decade decline in heat release, confirming that a persistent weakening of the AMOC is already underway.
The broader implications of these findings are profound. Because the reduction in ocean heat loss peaks overwhelmingly during winter months off the Canadian coast, the resulting AMOC slowdown will not manifest as a uniform year-round cooling. Instead, it will primarily express itself through shifting winter storm tracks, altered jet stream dynamics, and an increase in severe winter weather regime shifts across Northwest Europe.
As physical evidence confirms that Europe’s primary thermal engine is losing momentum, critical questions emerge for societal adaptation: How rapidly will these altered winter dynamics impact European agricultural systems, coastal infrastructure, and energy grids—and are our climate adaptation frameworks prepared for an Atlantic Ocean system undergoing fundamental change?
Bell, M et al. Evidence the ocean is losing less heat in the northern Atlantic and the AMOC has started to slowly weaken, 07 October 2026, PREPRINT (Version 1) available at Research Square [https://doi.org/10.21203/rs.3.rs-10854125/v1]
Terhaar, J., Vogt, L. & Foukal, N.P. Atlantic overturning inferred from air-sea heat fluxes indicates no decline since the 1960s. Nat Commun 16, 222 (2025). https://doi.org/10.1038/s41467-024-55297-5


Leave a Reply