
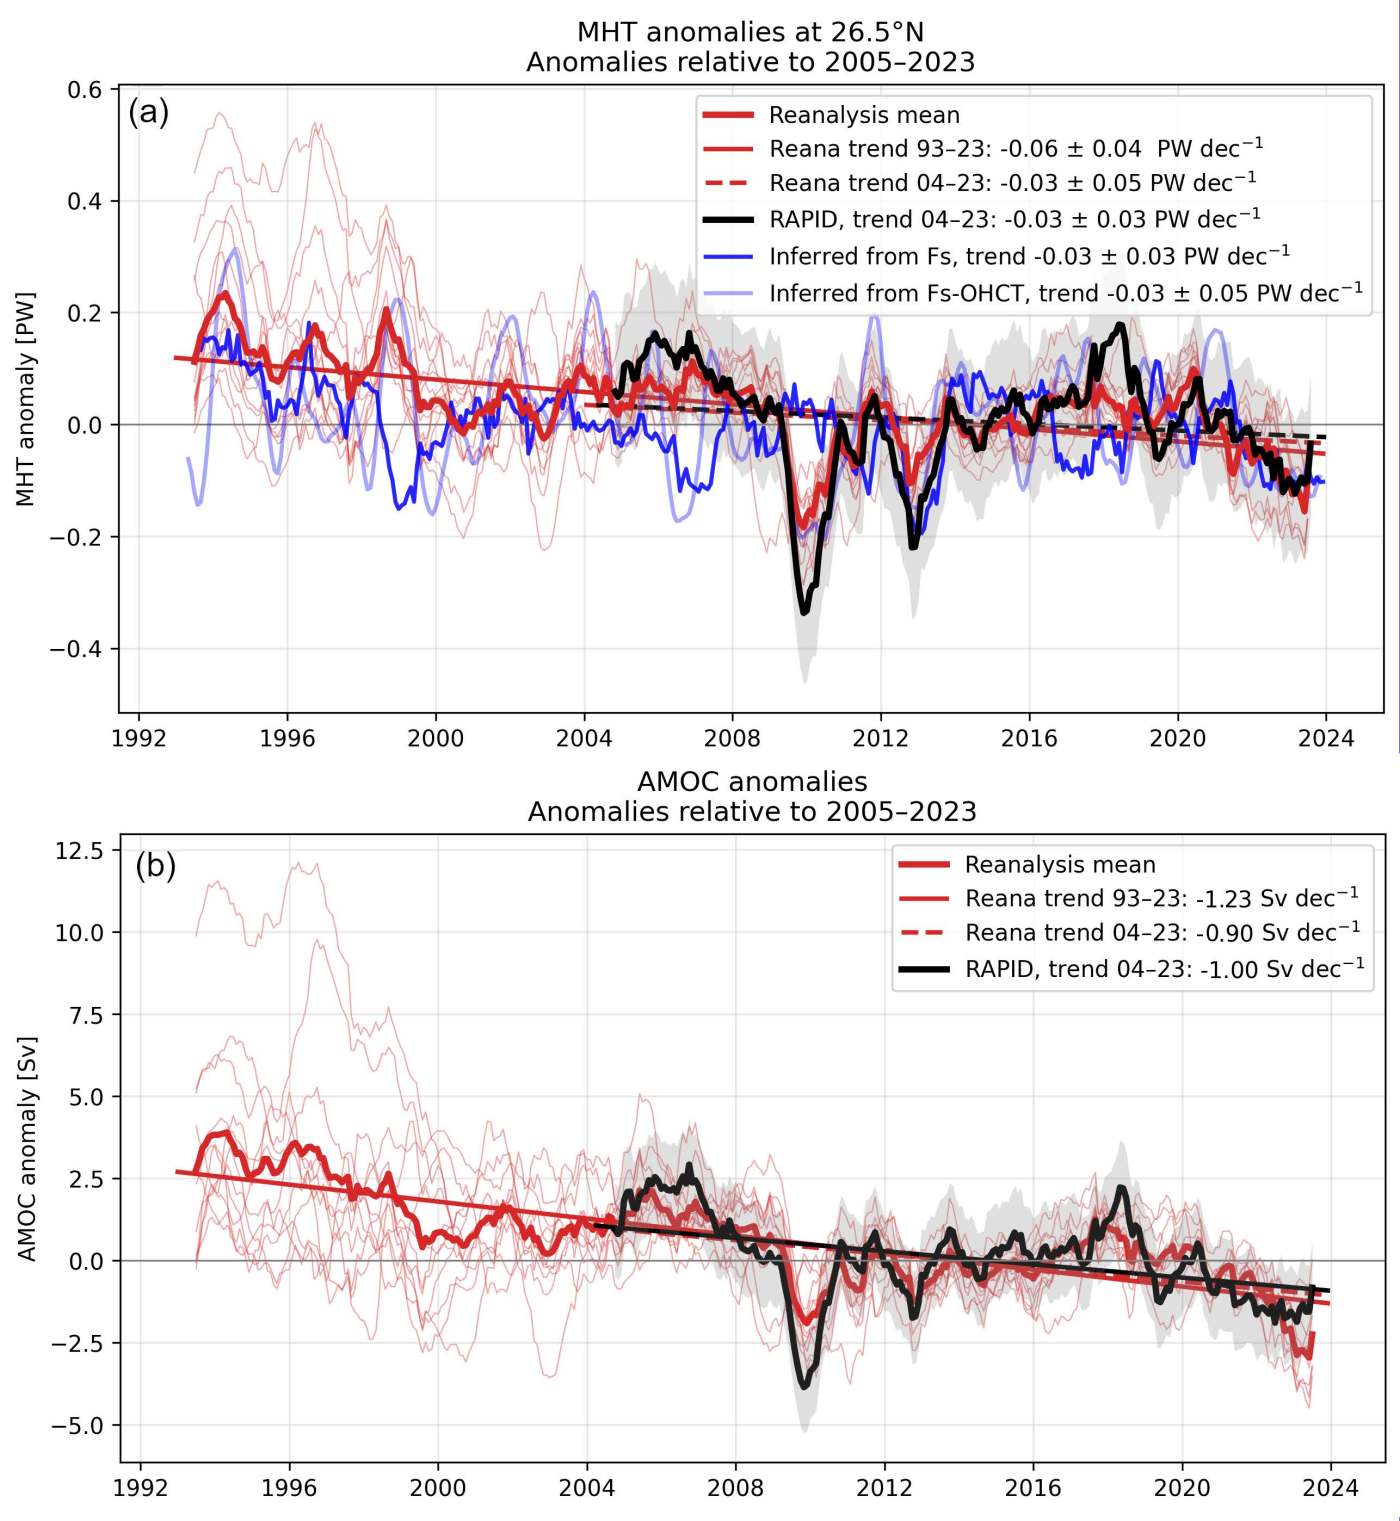
Figure 11 from Winkelbauer et al. (2026). MHT and AMOC anomalies at 26.5°N. a) MHT anomalies. b) AMOC anomalies. Thin red curves show individual reanalysis products and the thick red curve denotes the ensemble mean. Thick black curves show RAPID observations. The blue curve in the upper panel shows the inferred MHT estimate, calculated as the mean over ERA5, JRA3Q and MERRA2. the light blue curve shows the inferred MHT estimate in combination with IAPv4. All anomalies are referenced to the 2005–2023 mean, except for the inferred estimate, which is referenced to its available period (2005–2021). Solid red lines indicate linear trends calculated from the reanalysis ensemble mean over 1993–2023, and dashed red lines show trends over the RAPID period (2004–2023). The dashed black line shows the RAPID trend over 2004–2023. Displayed anomalies are shown as 12-month running means, while trend estimates are calculated from the unsmoothed anomaly time series
This blog post and the “Deep Dive” podcast, created by Google Notebook, are based on “Atlantic Meridional Heat Transports from Ocean Reanalyses, Monitored Sections and Heat Budget Constraints” by Winkelbauer et al. (2026).
This preprint article evaluates Atlantic Meridional Heat Transport by comparing seventeen global ocean reanalyses with sustained in-situ observations and indirect heat-budget calculations across major observing networks and Arctic gateways. The study examines both temporal variability and mean states from 1993 to 2025, demonstrating generally good agreement within two standard deviations despite existing regional biases and uncertainties. The findings reveal that increasing model resolution improves consistency when using monthly outputs, whereas coarse-resolution products require explicit inclusion of parameterized eddy terms to prevent artificial transport errors. Furthermore, trend analyses across the ensemble indicate a widespread reduction in northward heat transport through most gateways since the early 1990s, highlighting the ongoing challenges in accurately capturing long-term climate dynamics.
Unveiling the Ocean’s Hidden Heat Pipeline
The Atlantic Meridional Heat Transport (MHT) functions as Earth’s central climate thermostat. Driven by the complex dynamics of the Atlantic Meridional Overturning Circulation (AMOC), this expansive oceanic system continuously pumps equatorial thermal energy toward the high latitudes, directly dictating European weather extremes, North Atlantic storm tracks, and Arctic sea ice cover.
To monitor this planetary heat flow, oceanographers depend on moored observation arrays anchored at critical oceanic chokepoints. While these in-situ arrays deliver exceptional, high-frequency physical measurements, their geographical distribution is sparse—leaving vast oceanic basins unmonitored for thousands of kilometers.
To bridge these spatial voids, climate scientists utilize Ocean Reanalyses (ORAs)—sophisticated ocean state estimates that merge multi-decadal fluid dynamics models with millions of satellite altimetry, sea surface temperature, and in-situ profiling float observations. Under the UN Ocean Decade framework, the Marine Environment Reanalyses Evaluation Project (MER-EP) recently executed a comprehensive benchmark study evaluating 17 global ORAs. Ranging from coarse grids to fine-scale eddy-rich systems, these products were systematically benchmarked against direct mooring arrays (including SAMBA, RAPID, OSNAP, the Greenland-Scotland Ridge, and key Arctic gateways) alongside independent, top-of-atmosphere energy-budget reconstructions. The evaluation revealed essential physical triumphs alongside critical structural flaws in how modern computational models represent the ocean’s thermal engine.
1. Coarse Resolution Models Require ‘Bolus’ Physics to Avoid Artificial Biases
In coarse ocean reanalyses (such as ECCO and ESTOC), mesoscale eddies—oceanic swirls spanning 10 to 100 kilometers—are too small to be explicitly resolved on the computational grid. Historically, heat transport across latitude bands in these models was computed using only the resolved monthly advective velocity () and potential temperature () fields.
Evaluating these coarse models exposes a major technical trap: deriving meridional heat transport solely from resolved monthly advective fields generates severe, unphysical spatial spikes and artificial transport extrema, particularly in the Southern Ocean between and .
To correct these synthetic artifacts, coarse systems must incorporate parameterized diffusive and eddy-induced (“bolus”) heat transport components, such as Gent-McWilliams eddy parameterizations. Including these sub-grid physics calculations eliminates spurious transport spikes and restores a smooth, physically consistent heat profile that matches global energy-budget constraints. The absolute necessity of these parameterized terms was demonstrated by the product CIGAR: lacking parameterized eddy contributions, CIGAR displayed severe artificial spikes across multiple ocean basins.
“For one-degree reanalyses, relying solely on resolved velocity and temperature fields introduces severe artificial biases. Including parameterized eddy and diffusive components is essential to achieving a physically consistent transport structure.”
2. The Arctic Gateway Swap: Compensating Errors Mask Inflow Route Discrepancies
At the northern edge of the Atlantic, warm ocean waters enter the Arctic basin through two primary physical bottlenecks: the Fram Strait and the Barents Sea Opening. When assessing ORA performance across these polar gateways, the ensemble uncovered a striking structural paradox.
Across individual models, reanalyses systematically underestimate heat transport flowing through the deep Fram Strait while simultaneously overestimating heat entering via the shallow Barents Sea Opening.
Despite these route-specific discrepancies, evaluating both gateways together as a combined Arctic inflow section () reveals a remarkable cancelling effect. Because the Fram Strait underestimation (negative blue z-scores in the bias matrix) and Barents Sea overestimation (positive red z-scores) are nearly equal in magnitude, the opposing errors compensate for one another. Consequently, the net calculated heat entering the Arctic basin aligns closely with total observational estimates.
Importantly, analyzing the underlying dynamics reveals that volume transport errors across these gateways are not systematic across reanalysis products—neither in sign nor in magnitude. This confirms that the persistent heat transport biases are not caused by simple volume flux errors, but are instead driven by water-mass property discrepancies, specifically incorrect spatial temperature distributions within the inflow water masses.
3. High Skill at RAPID vs. Disconnect at OSNAP
Model fidelity varies dramatically across latitudes, highlighting a sharp contrast between the highly predictable subtropical Atlantic and the highly challenging subpolar gyre.
- Subtropical Atlantic (RAPID Array at )
- Observational Mean MHT:
- Reanalysis Ensemble Mean:
- Temporal Correlation: (High Consistency)
- Subpolar Atlantic (OSNAP Array)
- Observational Mean MHT:
- Reanalysis Ensemble Mean:
- Temporal Correlation: Near 0.00 or Negative (Severe Disconnect)
At the RAPID section (), reanalyses perform exceptionally well at tracking multi-year heat transport variability, maintaining high temporal correlation coefficients between 0.75 and 0.80. The models consistently capture low-frequency transport fluctuations spanning multiple decades.
In contrast, the subpolar North Atlantic at the OSNAP section presents a formidable barrier for current state estimates. Across OSNAP, reanalyses yield near-zero or negative temporal correlations for annual low-frequency variability. Major observed transport events—such as the massive heat transport spikes recorded at OSNAP East in 2015 and 2020—were missed entirely by both reanalyses and energy-budget models.
Furthermore, while the reanalysis ensemble mean underestimates mean MHT at RAPID ( vs. observed), key methodological differences explain part of this baseline offset. Mooring-based RAPID estimates rely on thermal-wind geostrophic approximations, whereas reanalyses calculate transport directly from internal velocity fields, which handle upper-ocean western boundary currents and shallow wind-driven ageostrophic fluxes differently.
4. Brute Force Computing Isn’t a Silver Bullet: Higher Resolution Has Limits
A standard assumption in ocean modeling is that increasing horizontal grid resolution will automatically deliver proportional gains in transport accuracy. The evaluation of this 17-model ensemble directly challenges that assumption.
Stepping up from coarse grids to eddy-permitting configurations yields substantial, systematic reductions in mean transport biases. However, refining grid resolution further to eddy-rich domains (such as GLORYS12V1 or SODAv4) does not systematically outperform the top-performing reanalyses.
The physical explanation for this unexpected boundary lies in output frequency constraints. In this evaluation, reanalysis fields were analyzed using monthly mean fields, which is the highest temporal resolution standard across multi-decadal reanalysis archives. Monthly averaging masks sub-monthly velocity-temperature covariance terms (). Without high-frequency (daily) output fields, eddy-rich models cannot fully project their resolved mesoscale transient flux capabilities. For data consumers, this confirms that horizontal grid resolution alone cannot overcome atmospheric forcing uncertainties, assimilation scheme limitations, or inaccurate water-mass property representations.
5. Decadal Trends Point to a Broad Reduction in Atlantic Heat Transport
Examining the multi-decadal reanalysis ensemble across the 1993–2023 era provides a cohesive view of long-term climate trajectories across the Atlantic basin.
Across the vast majority of Atlantic latitude bands and ocean gateways, the reanalysis ensemble mean reveals a statistically robust, widespread decline in northward heat transport over the past 30 years.
- 30-Year MHT Linear Trend at (RAPID):
While absolute heat transport decline is largest in magnitude within the warm subtropical North Atlantic, a critical spatial nuance emerges when normalizing these trends: the relative decline (expressed as a percentage of climatological mean transport per decade) is actually most severe in the subpolar North Atlantic, where baseline transport totals are smaller (). While data sparse conditions prior to the global deployment of Argo floats (pre-2005) introduce larger early-record uncertainty, independent top-of-atmosphere energy-budget reconstructions strongly corroborate this decadal slowdown.
Rethinking How We Monitor the Ocean’s Climate Engine
Modern ocean reanalyses have matured into robust diagnostic tools capable of capturing multi-year subtropical variability and establishing decadal climate baselines across the Atlantic. However, systematic baseline low biases and route-partitioning errors in high-latitude pathways demonstrate that computational models cannot yet replace sustained in-situ observing networks.
As climate science confronts potential AMOC stability thresholds and shifting regional weather systems, how will integrating next-generation satellite energy budgets with high-frequency data assimilation transform our ability to forecast the ocean’s hidden climate engine?
Winkelbauer, S., Forget, G., Mayer, M., Bourdalle-Badie, R., Cipollone, A., Haimberger, L., Haines, K., Osafune, S., Song, Y., Storto, A., Yang, C., and Zuo, H.: Atlantic Meridional Heat Transports from Ocean Reanalyses, Monitored Sections and Heat Budget Constraints, EGUsphere [preprint], https://doi.org/10.5194/egusphere-2026-5435, 2026.


Leave a comment