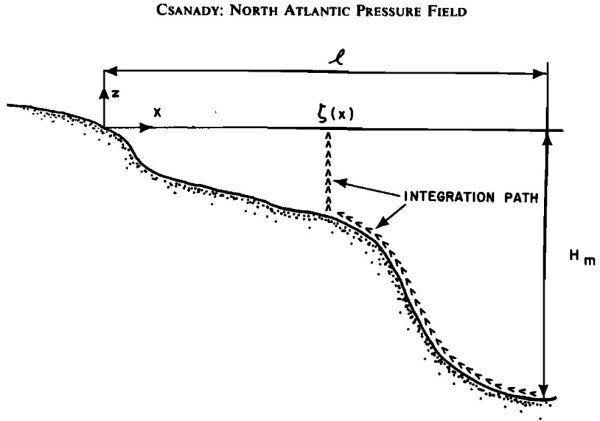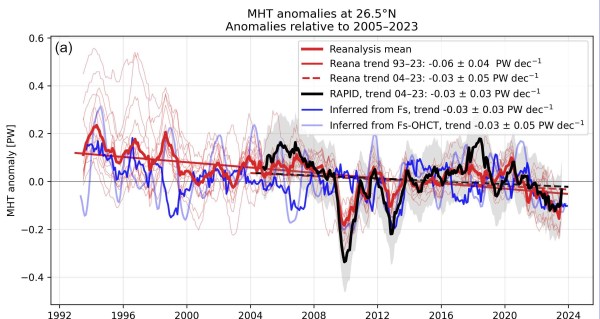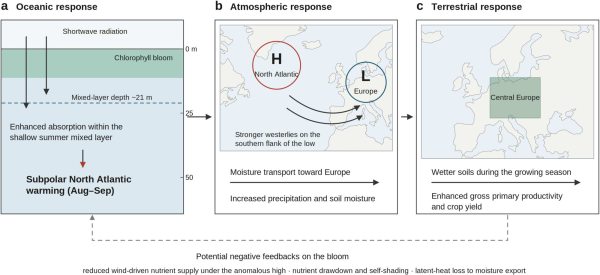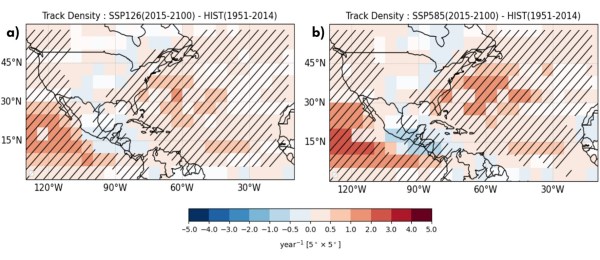
Figure 6 from Ender et al. (2026). EOFs 1 of monthly ERA5 sea level pressure over the North Atlantic (20°- 80°N, 90°W-0) for full record [(a); 1993–01 to 2023-12], Period 1 [(b); 1997–06 to 2001-10], and Period 2 [(c); 2004–02 to 2008-06]. Percent variance explained by each EOF is expressed in subplot titles. This study... Continue Reading →
Why the South Atlantic is Getting Saltier and Why It Matters for Our Climate
Figure 6 from Cui et al. (2026): (a) Linear trend of zonal wind stress (units: N m−2/decade) averaged over the period 1955–2014 from ERA5. The black solid line indicates the position of the Subtropical Front (STF) during 1955–1984, while the red dashed line represents the STF position during 1985–2014. The black polyline marks the location of... Continue Reading →
Is Global Warming Changing the Pacific Ocean’s Natural Cycles?
Figure 4 from Xing et al. (2025): Differences between the traditional and ensemble-mean removed methods (hereafter traditional-EM). (a) EOF1 and (b)) EOF2 spatial pattern; here differences are calculated between the ensemble mean of the traditional method applied to each ensemble member, and the ensemble mean of PDV calculated using the ensemble mean removed method. All calculations... Continue Reading →
SST Anomalies in the Tropical Eastern Pacific can dictate the climate of the North Atlantic a decade later
Figure 1 from Yang et al. (2026): The two leading joint EOF modes and their PCs of North Atlantic SST and AMOC decadal variability. (a) Decadal SST anomalies regressed onto the AMVTEP. Decadal SST (b) and AMOC (d) anomalies regressed onto the PC1. In panels (c, e) Same as (b, d) but for the PC2. Stipplings in (a–e) denote... Continue Reading →
New Study Reveals Key Local Blind Spots in Climate Model Projections
Fig. 2 from Aru et al. (2026): Partitioning of observed SAT trend patterns into external forcing and internal variability. (A) Total, (B) external forcing, and (C) internal variability observed SAT trend patterns for the most recent (D to F) 30-year (1993–2022) periods, respectively, by regressing observed local anomalies against the 1850–2022 MMLE GSAT time series. Hatched regions... Continue Reading →
How Super El Niño Could Shift the Planet into a New Climate Reality
Fig. 3 from Xue et al. (2025): Evidence of super El Niño-induced climate regime shifts (CRSs) across various regions and climatic variables. Time series of standardized anomalies for sea surface temperature (SST), surface air temperature (SAT), and surface soil moisture (Soil) across selected regions with respect to 1948–2022 climatology. The vertical black lines and blue... Continue Reading →
What Happens to the Planet if the Indonesian Throughflow Stops?
This blog post and the “Deep Dive” podcast, created by NotebookLM, are based on several studies, including "The Role of Indonesian Throughflow in a Global Ocean GCM." by Hirst and Godfrey (1993), "The Indonesian Throughflow’s Effect on Global Climate Determined from the COLA Coupled Climate System" by Wajsowicz and Schneider (2001), "Effects of the Indonesian... Continue Reading →
Strengthening of the Indonesian Throughflow Accelerated Indian Ocean Warming Contrary to Climate Model Projections
Figure 1 from Guo et al. (2026): Heat and volume transports across the IX1 section and within Makassar Strait. a, b Heat (a) and volume (b) transports of the upper 700 m across the IX1 section, based on relative geostrophic currents estimated with observational data of ocean temperature and salinity. The grey shading represents the... Continue Reading →
The warming hole has pushed the Atlantic summer jet stream southward
Fig. 1 from Sheng et al. (2026): Trend of the summer NAJ in the reanalyses and DAMIP simulations during 1980–2019. (A) ERA5 (the fifth generation European Centre for Medium Range Weather Forecasts atmospheric reanalysis of the global climate) trend (in meters per second per decade) of the zonal wind at 250 hPa and at the... Continue Reading →
The Rise and Fall of the Arctic Meridional Overturning Circulation (ArcMOC)
Fig. 13. from Bretones et al. (2022): Sketch summarizing the evolution of the deep mixing and the ArcMOC under the retreat of the sea ice edge. (a) During T0: 1970–80 there is deep convection on both sides of the Greenland–Scotland ridge. Both AMOC and ArcMOC are present, but the ArcMOC extent is limited by the... Continue Reading →