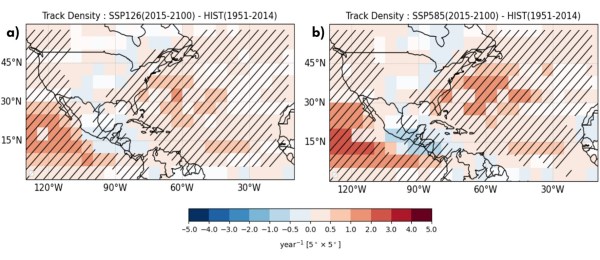
Figure 1 from Lele et al. (2026). Multi-Model Mean of track density change in the North Atlantic, calculated between future and historical periods for SSP1-2.6 (a) and SSP5-8.5 (b). Stippling shows regions with statistically significant differences at p=0.05 based on a two-sided Student's t-test from the 12-model, 10-track ensemble and 40-intensity ensemble. This blog post... Continue Reading →
Beyond El Niño: The Kuroshio-Oyashio Extension as a Precursor to California Winter Extremes
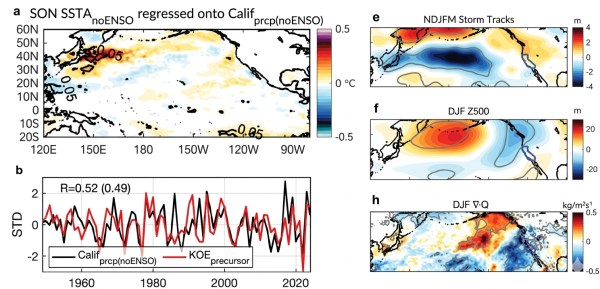
Reproduced from Figures 3 & 6 in Badezet-Delory (2026). (a) Regression of preceding September-November (SON) SST anomalies (°C), with tropical forcing removed, onto the ENSO-independent JFM California precipitation. (b) Comparison of the standardized timeseries of the ENSO-removed JFM California precipitation (black line) and the high-pass-filtered SON KOE precursor index (red line; cut off of 40... Continue Reading →
North Atlantic Temperature Regimes Increase Long-Range Weather Predictability
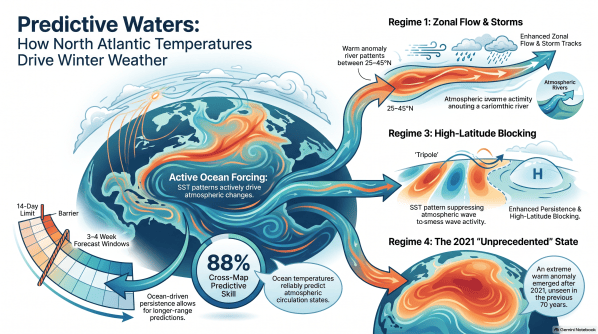
This infographic was generated by Google Notebook. This blog post and the “Deep Dive” podcast, created by Google Notebook, are based on a preprint article “North Atlantic SST Drives Sub-seasonal Variability and Predictability of the Large-Scale Circulation” by Murphy et al. (2026). A preprint article by Murphy et al. (2026) investigates the causal relationship between North... Continue Reading →
Why High-Latitude Marine Heatwaves are Supercharging Coastal Carbon Sinks
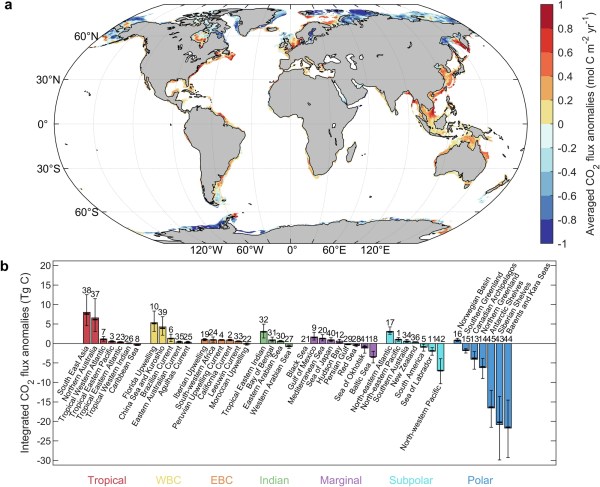
Figure 1 from Hu et al. (2026). a Spatial distribution of averaged air–sea CO2 flux anomalies (mol C m−2 yr−1) during MHW months across the global coastal ocean, derived from the observation-based ULB–SOM–FFN–coastalv2 dataset. Positive anomalies indicate enhanced CO2 outgassing or reduced uptake, whereas negative anomalies represent enhanced uptake or reduced outgassing. b Integrated CO2 flux anomalies (Tg C) across 45 coastal... Continue Reading →
Why the Pacific is Cooling in a Warming World
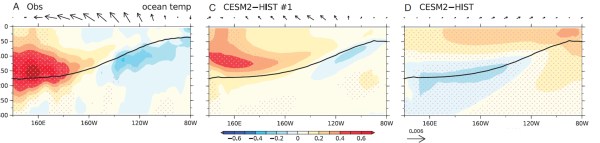
Derived from Figure 2 in Xie et al. (2026). Observed and simulated 1982–2024 trends in equatorial ocean temperature. Linear trend of equatorial (2.5°S to 2.5°N mean) ocean temperature trends (°C/decade) in (A) OISST, (C) a CESM2-HIST member run with the strongest La Nina-like trend, and (D) the CESM2-HIST ensemble mean. Stippling indicates 90% confidence. The... Continue Reading →