
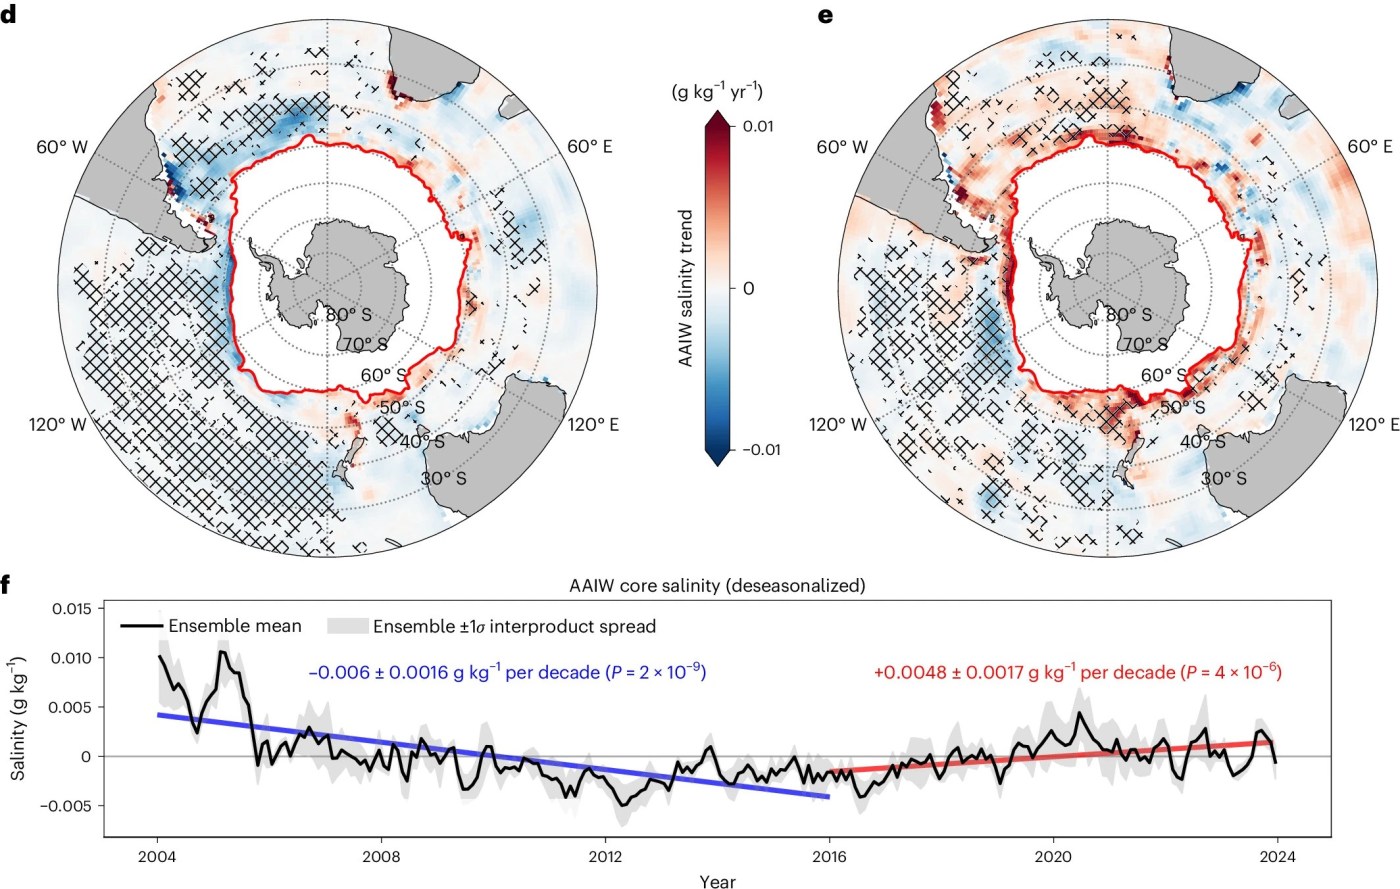
Figure 3d,e,f from Mishra et al. (2026): Evolution of WW and AAIW core salinity anomalies. Linear-trend maps of AAIW core salinity for 2004–2015 (d) and 2016–2024 (e) (in grams per kilogram per year). Time series of circumpolar-mean AAIW core salinity (f) (all deseasonalized), with linear trends for 2004–2015 (blue) and 2016–2024 (red). Monthly anomalies are computed relative to the 2004–2024 mean. Shaded envelopes in (f) denote the ±1σ ensemble uncertainty, combining the inter-product spread and dataset-specific observational uncertainties across all hydrographic products. Trends are estimated using the Hamed–Rao modified Mann–Kendall test68 (two-sided) and are annotated in the time series plots (f) as mean slope ±1σ uncertainty. Red lines in (d,e) indicate the climatological Polar Front. The cross-hatching in the maps marks points with trends significant at the 95% level. Basemaps in (d,e) generated using Cartopy with data from Natural Earth (https://www.naturalearthdata.com).
This blog post and the “Deep Dive” podcast, created by Google Notebook, are based on “Reversal of Antarctic Intermediate Water trends triggered by sea ice decline” by Mishra et al. (2026).
Mishra et al. (2026) shows that Antarctic Intermediate Water (AAIW) has undergone a major transformation governed by seasonal sea-ice dynamics. Before 2015, expanding sea ice (~8% per decade) increased summertime meltwater export toward the Polar Front. Although winter ice growth causes local brine rejection, massive summer meltwater capped the upper ocean, enhancing stratification. This sea-ice meltwater specifically conditioned the subducting surface layer, creating a fresher, lighter, and shallower ocean layer (shoaling at ~7 m per decade) that spread across the Southern Hemisphere. However, an unprecedented decline in sea ice since 2016 has reduced freshwater input, and thus promoted the upwelling of warm, saline Circumpolar Deep Water (CDW). Consequently, this widespread sea-ice loss modified the source surface water—accounting for ~95% of the AAIW salinity increase—and triggered the densification and salinification of subsurface waters, causing both key water masses to become saltier, denser, and deeper (~8 m per decade deepening).
1. Introduction: The Flip of the Southern Ocean Engine
For decades, oceanographers tracking the deep waters of the Southern Hemisphere observed a persistent, comforting pattern: the vast intermediate layers of the ocean were growing steadily fresher and lighter. Driven by an expanding ring of Antarctic sea ice, seasonal meltwater poured into the open ocean, reinforcing a buoyant protective layer at the surface. But in 2016, that decades-long trajectory came to a sudden, dramatic halt.
An unprecedented collapse in Antarctic sea ice flipped the hydrographic switch. Almost overnight, the surface dynamics of the Southern Ocean transformed, sending shockwaves down into the deep sea. At the heart of this transformation is Antarctic Intermediate Water (AAIW)—a massive, oxygen-rich water mass spanning depths between 700 and 1,200 meters. Originating just south of the Polar Front (PF), AAIW acts as a primary arterial network for the global ocean, spreading northward into the Atlantic, Pacific, and Indian Oceans and dictating the vertical density structure (the pycnocline) across the Southern Hemisphere.
“The Southern Ocean, often described as the engine room of Earth’s climate system, hosts the Antarctic sea-ice cap and plays an outsized role in determining the vertical structure and properties of the global ocean.”
2. Takeaway 1: A 180-Degree Flip — From Decades of Freshening to Rapid Salinification
Between 2004 and 2015, the Antarctic sea-ice cap experienced a modest expansion of roughly 8% per decade, adding about 0.75 million square kilometers of ice cover. This expanding ice cap boosted the net northward transport of sea-ice meltwater by +13.52 ± 3.34 mSv per decade. As this abundant freshwater melted near the Polar Front, it capped the surface ocean, causing the underlying AAIW core to freshen (−0.006 ± 0.0016 g kg⁻¹ per decade), lighten in density (−0.0164 ± 0.0043 kg m⁻³ per decade), and shoal upward by about 7 meters per decade (−7.04 ± 2.08 m per decade).
After 2015, this regime completely inverted. Consecutive years of record-low sea-ice extent reduced the sea-ice area by approximately 6% per decade. This sudden crash cut the northward sea-ice meltwater flux by −37.21 ± 16.45 mSv per decade—a net shift of nearly 36 mSv per decade compared to the pre-2016 expansion era. Starved of surface freshwater, the AAIW core underwent a rapid reversal: its salinity climbed at +0.0048 ± 0.0017 g kg⁻¹ per decade, its density increased by +0.0083 ± 0.0045 kg m⁻³ per decade, and its core plunged deeper into the water column at a rate of +7.99 ± 3.31 meters per decade.
This 180-degree turn presents a counter-intuitive reality. While popular climate narratives often assume that global warming leads to fresher oceans via melting ice, the collapse of seasonal Antarctic sea ice actually reduces the open-ocean meltwater supply. Without that seasonal freshwater cap, saltier deep waters upwell to the surface, ultimately making the intermediate ocean denser and saltier.
This salinification occurred despite a concurrent increase in atmospheric precipitation over the Southern Ocean (+6 mSv per decade), consistent with the “wet gets wetter” climate paradigm. That the intermediate ocean salinified while rainfall increased demonstrates that the post-2015 drop in sea-ice meltwater export was so massive that it completely overwhelmed the hydrological cycle’s precipitation inputs.
| Metric (AAIW Core Trend) | Pre-2016 Regime (2004–2015) | Post-2015 Regime (2016–2024) |
| Sea-Ice Transport Change | +13.52 ± 3.34 mSv / decade | −37.21 ± 16.45 mSv / decade |
| Core Salinity Trend | −0.006 ± 0.0016 g kg⁻¹ / decade (Freshening) | +0.0048 ± 0.0017 g kg⁻¹ / decade (Salinification) |
| Core Density Trend | −0.0164 ± 0.0043 kg m⁻³ / decade (Lightening) | +0.0083 ± 0.0045 kg m⁻³ / decade (Densification) |
| Core Depth Movement | −7.04 ± 2.08 m / decade (Shoaling) | +7.99 ± 3.31 m / decade (Deepening) |
Understanding this dramatic shift requires re-examining which form of polar ice truly governs the properties of intermediate ocean layers.
3. Takeaway 2: Sea Ice, Not Glacial Ice Sheets, Holds the Steering Wheel for Intermediate Waters
Public attention regarding Antarctic ice loss is almost universally focused on land-based ice sheets and giant continental ice shelves. However, when it comes to steering mid-depth oceanic water masses across the Southern Hemisphere, seasonal sea ice plays a vastly superior role.
The annual volume of freshwater cycled through Antarctic sea ice (~1.74 × 10⁴ Gt yr⁻¹) is an order of magnitude larger than the freshwater discharge originating from Antarctic ice shelves (~1.6 × 10³ Gt yr⁻¹).
While glacial ice-shelf melting discharges freshwater primarily into high-latitude coastal zones—shaping the precursor waters of abyssal Antarctic Bottom Water—sea ice melts directly in the open ocean near the Polar Front. This open-ocean positioning gives sea ice direct control over the formation of Antarctic Intermediate Water and the upper cell of the global overturning circulation.
This reduction in surface sea-ice melting has directly throttled the upper branch of the Southern Ocean overturning circulation. Quantitative estimates of surface Water Mass Transformation (WMT) reveal that the transformation rate (Q) converting Circumpolar Deep Water into AAIW dropped from 13 Sv (Q_{pre}) to 11 Sv (Q_{post}) across the regime shift. This 2 Sv decline represents a ~15% slowdown in the formation rate of the upper overturning cell, illustrating how sea-ice mechanics dictate the strength of global ocean circulation.
To understand how these surface ice dynamics alter conditions 1,000 meters below, one must trace the multi-step subduction mechanism across the Polar Front.
4. Takeaway 3: Surface Ripples to 1,000-Meter Depths — The Mechanism of Subduction
How does a change in surface ice cover alter water masses thousands of feet beneath the waves? The oceanographic conveyor belt operates through a clear, multi-step subduction process:
- Winter Sea-Ice Growth: Cold polar winds drive sea-ice formation south of the Polar Front. As sea ice freezes, it expels salt through brine rejection, generating a cold, dense, and uniform surface layer known as Winter Water (WW).
- Spring Melting: As temperatures rise, spring sea-ice melt releases a surge of freshwater at the surface. This fresh layer stratifies the upper ocean and traps a remnant, freshened layer of WW beneath the seasonal mixed layer.
- Subduction Across the Polar Front: Driven by ocean circulation, this modified WW plunges northward down steeply tilted density surfaces (isopycnals within the 26.9 to 27.53 kg m⁻³ potential density range). As it subducts beneath warmer subtropical waters, it forms the AAIW core at depths of 700 to 1,200 meters.
- The Post-2015 Breakdown: With less winter sea ice forming and less spring meltwater released post-2015, the upper ocean loses its protective freshwater stratification. Warm, salty Upwelling Circumpolar Deep Water (CDW) mixes upward into the surface layer, making the WW significantly saltier and denser. When this heavier WW subducts across the Polar Front, it creates an AAIW layer that is denser, saltier, and positioned deeper in the water column.
Diagnostic modeling confirms that ~95% of the observed post-2015 AAIW salinification is directly driven by property changes at the Winter Water source region, rather than vertical displacement (“heave”) of density surfaces. This proves that the ocean engine’s water mass properties themselves have fundamentally altered at their point of origin.
These altered source waters do not spread uniformly; instead, their impact ripples across global ocean basins in a distinct geographic pattern.
5. Takeaway 4: Ocean Basin Asymmetry — Why the South Atlantic and Southeast Pacific Are Ground Zero
The post-2015 regime shift has not unfolded identically across the globe; rather, it exhibits distinct regional hotspots dictated by ocean currents and basin geometry:
- Southeast Pacific: Recognized as the primary origin point for AAIW formation, this region experienced intense freshening prior to 2016 (exceeding −0.05 g kg⁻¹ per decade) due to highly focused Winter Water subduction.
- South Atlantic: Functioning as the primary receptor of these waters, the South Atlantic receives subducted signals advected eastward through Drake Passage by the Antarctic Circumpolar Current (ACC). Prior to 2016, it experienced freshening rates exceeding −0.07 g kg⁻¹ per decade. Following 2015, the South Atlantic suffered an amplified contraction in AAIW volume because it lacks an overlying buffer of Subantarctic Mode Water (SAMW).
- Indian and Pacific Sectors: In contrast to the Atlantic, the Indian and western/central Pacific oceans are dominated by SAMW formation. Strong surface warming caused SAMW to expand volumetrically, masking or buffering the depth changes of the underlying AAIW core in these basins.
This complex spatial mosaic reveals why detecting and predicting deep-ocean shifts presents such a formidable hurdle for numerical climate simulations.
6. Takeaway 5: A Challenge for Climate Models — The Unpredicted Regime Shift
The abrupt post-2015 flip in the Southern Ocean highlights a critical gap between theoretical climate projections and real-world ocean behavior:
- Model Limitations: State-of-the-art global climate models regularly struggle to simulate the sudden, steep collapse of Antarctic sea ice after 2015. Furthermore, models frequently fail to capture the complex, fine-scale physical mechanisms linking sea-ice dynamics, upper-ocean stratification, and subsurface water mass formation.
- Observational Certainty: Despite model shortcomings, observational confidence in this salinification signal is exceptionally high. Thanks to the global Argo float array, hydrographic sampling density north of the Polar Front (55°S–30°S) improved by a factor of 2.4 after 2015—with 62.3% of regional grid cells sampled in more than 75% of months (compared to 26% of cells pre-2016).
7. Conclusion: The Hemispheric Ripple Effect
The dramatic reversal of Antarctic Intermediate Water properties marks an ongoing, fundamental restructuring of the Southern Hemisphere pycnocline. Because AAIW serves as a major upper branch of the global meridional overturning circulation, these newly salinified, denser waters will not remain isolated in the polar south. Over the coming years and decades, this dense, salty ocean signal will advect northward toward low-latitude basins.
As these transformed intermediate waters infiltrate the tropical and subtropical oceans, how will the restructuring of Antarctica’s ocean engine alter global climate patterns, marine ecosystems, and the future stability of the planet’s atmospheric and oceanic circulation?
Mishra, K., Gayen, B. & Naveira Garabato, A.C. Reversal of Antarctic Intermediate Water trends triggered by sea ice decline. Nat. Clim. Chang. 16, 1287–1297 (2026). https://doi.org/10.1038/s41558-026-02758-y


Leave a Reply