
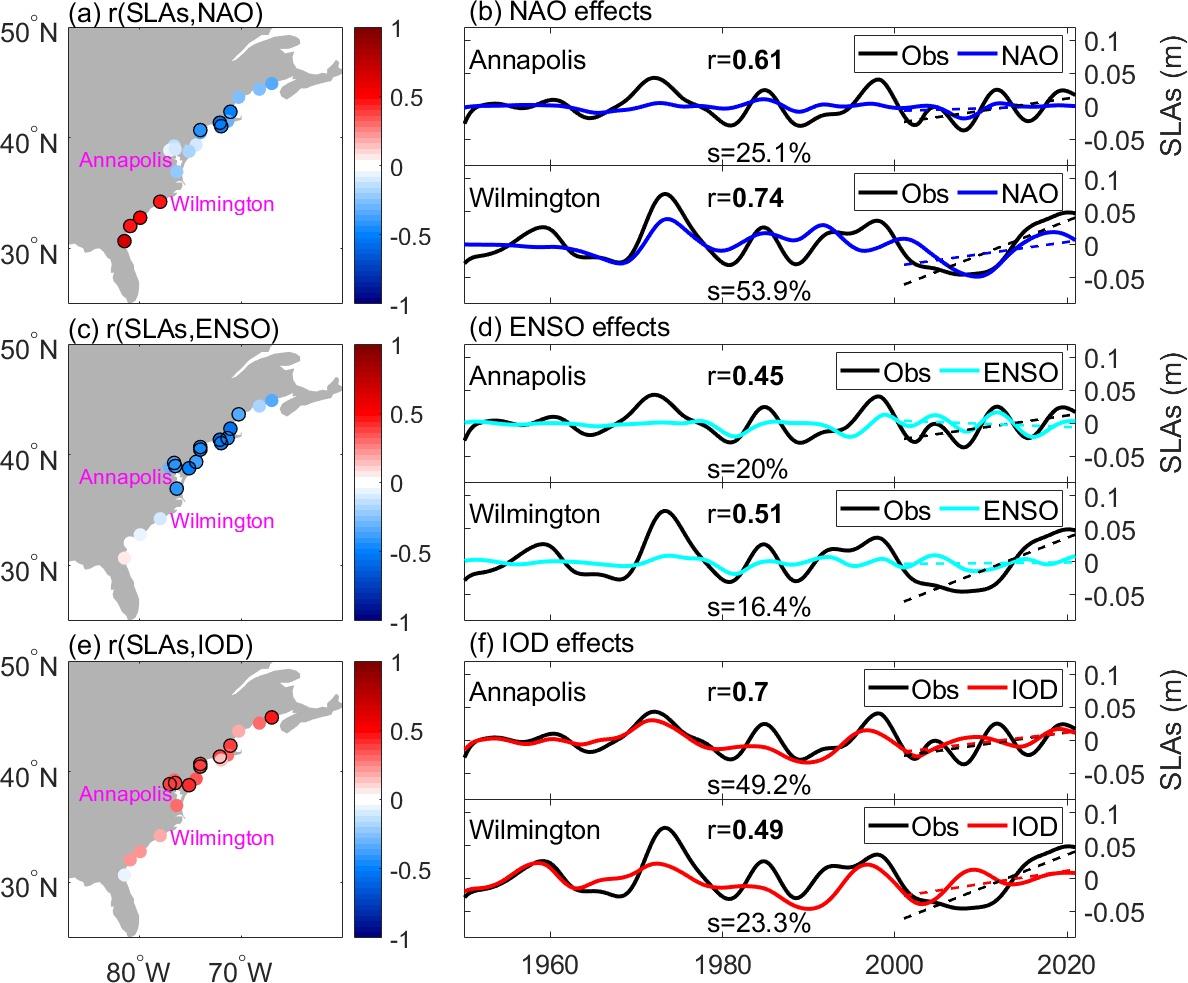
Figure 5 from Zhu et al. (2026). Relationships between decadal sea level anomalies (SLAs) and climate modes for the 1950-2020 period. (a) Correlation coefficients between decadal SLAs (with global mean sea level (GMSL) removed) from tide gauge data and the North Atlantic Oscillation (NAO) index. (b) Decadal SLAs from tide gauge observation (black line) and from contributions of the NAO using a Bayesian dynamic linear model (BDLM) at Annapolis and Wilmington. (c-d) Same as (a-b) but for the relationship between decadal SLAs and the El Niño-Southern Oscillation (ENSO). (e-f) Same as (a-b) but for the relationship between decadal SLAs and Indian Ocean Dipole (IOD). Dashed lines are the linear trends during the period of 2001-2020. Values of r are correlations between observed and BDLM modeled SLAs. Values of s are percentages of explained SLA variance by the BDLM. Significant values (p values smaller than 0.1 ranges from 1×10⁻³ to 0.09) in (a), (c) and (e) are marked with black circles. Significant correlation values with two-sided t-test (p≤0.1) in (b), (d) and (f) are in bold.
This blog post and the “Deep Dive” podcast, created by Google Notebook, are based on “Large-scale climate oscillations induce accelerated high tide flooding along the U.S. East Coast” by Zhu et al. (2026).
Zhu et al. (2026) examines the recent and long-term acceleration of high tide flooding along the United States East Coast. By analyzing tide gauge data and climate models, the study determines that decadal sea level anomalies have become more influential than the general rising trend in driving recent flood frequency. The study identifies large-scale climate oscillations as primary drivers, specifically linking the Indian Ocean Dipole to flooding in the Mid-Atlantic Bight through its impact on the Atlantic Meridional Overturning Circulation. Simultaneously, the North Atlantic Oscillation is found to dominate flooding patterns in the South Atlantic Bight via wind-driven ocean waves. These findings suggest that remote forcing from the Indian Ocean must be integrated into climate models to improve decadal predictions for coastal planning. Ultimately, the research highlights how complex atmospheric teleconnections and ocean dynamics converge to increase the vulnerability of East Coast infrastructure.
Introduction: The “Sunny-Day” Nuisance is Becoming a Crisis
For residents of coastal hubs like Annapolis, Maryland, or Charleston, South Carolina, flooding is no longer a rare event tethered to the arrival of a major hurricane. It has become a “sunny-day” nuisance. Technically known as High Tide Flooding (HTF), this phenomenon occurs when local sea levels exceed minor flooding thresholds during high tide, even under clear skies.
While we typically point to global sea-level rise as the primary culprit, new research reveals that the forces pushing water onto our streets are far more complex—and global—than we imagined. A 2026 study by Zhu et al., published in Communications Earth & Environment, identifies specific “master switches” in the climate system that act like remote controls for our coastlines. By analyzing data from 1950 to 2020, researchers have discovered that some of the most significant drivers of flooding on the U.S. East Coast (USEC) actually originate half a world away in the Indian Ocean.
Takeaway 1: We’ve Entered an Era of “Accelerated” Flooding
The data confirms a sobering reality: flooding is not just increasing; it is speeding up. In the 1950s, cities like Annapolis and Wilmington, North Carolina, typically saw less than one day of HTF per year. By 2020, that frequency surged to over 15 days annually.
It is crucial to distinguish between a trend and acceleration. A trend is a steady, linear rise over time. Acceleration means the rate of that rise is increasing. The study notes that while the frequency (the number of days) has accelerated sharply, there is a silver lining: High-tide flooding intensity (HTFI) has not shown a statistically significant increase. This means that while it is flooding much more often, the individual “nuisance” floods aren’t necessarily getting deeper—at least not yet.
The societal cost of this increased frequency remains a massive hurdle for coastal resilience:
“HTF disrupts the daily lives of human society and causes significant damage to property, infrastructure, and local economies, as approximately 3.7 million people in the U.S. live within 1 m of high tide.”
Takeaway 2: It’s Not Just Climate Change—It’s “Decadal Bumps”
While the long-term rise in global sea levels (driven by melting ice and warming oceans) sets the “floor” for high water, the study found that recent flooding spikes (2011–2020) are dominated by decadal sea level anomalies (SLAs).
The Power of the 8-to-10 Year Cycle
Think of these anomalies as “natural bumps” in the ocean surface. These cycles are detrended, meaning they are independent of long-term human-caused warming, and they typically last about 8 to 10 years. During the period from 2011 to 2020, these decadal bumps accounted for more than 50% of the total flooding increase in several major cities. When these natural cycles align with the human-caused long-term trend, they can temporarily double the impact of sea-level rise, creating the dramatic “acceleration” we’ve seen over the last decade.
Takeaway 3: The Indian Ocean Connection (The Most Surprising Link)
The most groundbreaking finding of the Zhu et al. study is the remote impact of the Indian Ocean Dipole (IOD). This climate pattern, occurring thousands of miles away, acts as a “butterfly effect” for the Mid-Atlantic Bight (MAB) and the Chesapeake Bay.
This happens through an atmospheric teleconnection. When the Indian Ocean shifts, it excites atmospheric “Rossby waves” that travel across the globe. This process triggers a chain reaction that weakens the Atlantic Meridional Overturning Circulation (AMOC)—the great “conveyor belt” of the Atlantic.
The Math of the Connection:
- Since 2001, the modeled AMOC has weakened by approximately 1.2 Sv (about 15%).
- This weakening causes water to “pile up” against the U.S. East Coast.
- The result is an additional 2 cm of sea-level rise in Annapolis and 2.4 cm in Wilmington attributed specifically to this buoyancy-driven shift.
Notably, older climate models (CMIP6) often missed this link. This research represents a breakthrough because it utilized High-Resolution Modeling (with grid spacing smaller than 0.25°), allowing scientists to finally see how these global master switches connect.
Takeaway 4: Cape Hatteras is the Coastal “Master Switch” Divider
Coastal flooding is not a “one size fits all” problem. The study identifies Cape Hatteras as the critical geographic dividing line between two different climate regimes.
- North of Cape Hatteras (Mid-Atlantic Bight): Flooding is primarily influenced by the Indian Ocean/AMOC connection described above.
- South of Cape Hatteras (South Atlantic Bight): For cities like Charleston and Fort Pulaski, the North Atlantic Oscillation (NAO) is running the show.
In the South, the NAO drives wind-driven oceanic Rossby waves. These are physical waves in the ocean—not just the atmosphere—that push water westward toward the southern coastline. This highlights why different regions need different “master switches” to monitor for flooding alerts.
Takeaway 5: Storm Surges Aren’t the Primary Driver of the Trend
Perhaps the most counter-intuitive finding is that “synoptic” events—the tropical cyclones and storm surges we fear most—have had a negligible or even negative contribution to the acceleration of annual flooding time.
While a single hurricane can cause a catastrophic disaster, they are not the reason your local street floods 15 times a year. The steady, cumulative increase in flooding days is driven by deeper ocean dynamics and decadal anomalies rather than a change in storm frequency. Individual storms are the “shocks,” but the Indian Ocean and the NAO are the “gears” steadily shifting the baseline.
Conclusion: Rethinking Coastal Planning
The findings from Zhu et al. (2026) are a call to action for coastal planners and city budget officers. We can no longer rely solely on global sea-level rise averages to prepare for the future. Instead, we must move toward a “joint consideration” of global trends and remote climate modes like the IOD and NAO.
Because these “decadal bumps” operate on predictable 8-to-10-year cycles, our ability to forecast them is improving. This gives us a window for better mid-term planning—allowing cities to prioritize infrastructure spending during “high-bump” decades.
As we refine our high-resolution models, we are forced to confront a new reality: How must we adapt our local infrastructure to a world where the primary driver of a flood in your backyard is a climate shift occurring half a world away?
Zhu, Y., Han, W., Garuba, O. et al. Large-scale climate oscillations induce accelerated high tide flooding along the U.S. East Coast. Commun Earth Environ (2026). https://doi.org/10.1038/s43247-026-03932-y


Leave a Reply