
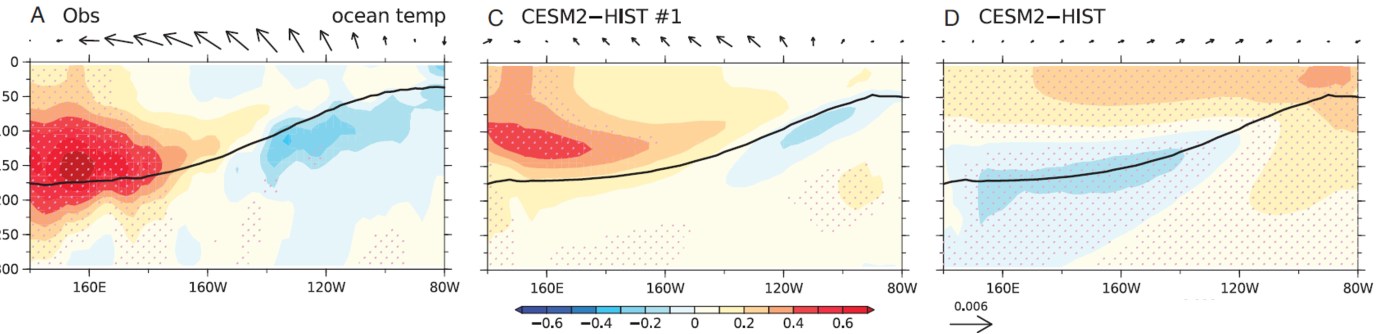
Derived from Figure 2 in Xie et al. (2026). Observed and simulated 1982–2024 trends in equatorial ocean temperature. Linear trend of equatorial (2.5°S to 2.5°N mean) ocean temperature trends (°C/decade) in (A) OISST, (C) a CESM2-HIST member run with the strongest La Nina-like trend, and (D) the CESM2-HIST ensemble mean. Stippling indicates 90% confidence. The black line marks the climatological- mean 20 °C isotherm, approximating the thermocline depth. Black arrows at the top denote the equatorial surface wind stress trends (N m−2/decade) in (A) observations and (C–D) as simulated internally in the CESM2 runs, respectively. Observations are based on EN4 and ERA5.
This blog post and the “Deep Dive” podcast, created by Google Notebook, are based on “Major role for internal variability in tropical Pacific warming pattern over satellite era” by Xie et al. (2026)
Xie et al. (2026) identifies internal climate variability as the primary cause of the cooling trend observed in the eastern tropical Pacific between 1982 and 2024. While most climate models predicted warming in this region due to greenhouse gases, the study uses wind-stress pacemaker experiments to show that natural shifts in trade wind intensity actually drove the observed sea surface temperature patterns. A key finding is that subsurface warming in the western Pacific acts as a distinct fingerprint of this unforced multidecadal variability. By analyzing data back to the 1950s, the authors demonstrate that recent changes are part of a cyclic transition rather than a permanent response to external forcing. Consequently, the authors suggest that the current cooling phase will likely end, eventually aligning with long-term global warming projections.
1. Introduction: The Tropical Mystery
For over forty years, the narrative of climate change has been defined by a steady, global fever. Yet, if you look at a map of sea surface temperatures since the “satellite era” began in 1982, you will find a striking paradox right at the planet’s equator. While the rest of the world has heated up, a significant portion of the eastern tropical Pacific—a region often called the “cold wedge”—has remained stubbornly cool, even trending colder in some sectors.
This isn’t just a regional quirk; it is a profound scientific mystery. The tropical Pacific is the engine room of the global climate. Its temperature fluctuations dictate the severity of California droughts, the frequency of tropical cyclones, and the behavior of storm tracks across both hemispheres. In an “Inaugural Article” for the Proceedings of the National Academy of Sciences (PNAS), lead author Shang-Ping Xie and his colleagues address a troubling discrepancy: while most state-of-the-art climate models predicted an “El Niño-like” warming of this region, the real-world ocean did the exact opposite. Solving this mystery is not just about correcting the maps; it is about determining if our climate models are fundamentally flawed or if we are simply misinterpreting the “noise” of a complex natural system.
2. Takeaway 1: Natural Cycles, Not Greenhouse Gases, are Driving Current Pacific Patterns
The central finding of the Xie et al. study is that the unexpected cooling in the eastern Pacific is not a failure of physics, but a testament to the power of “internal variability”—the natural, unforced rhythms of the climate system.
The researchers found that while human-induced greenhouse gases are indeed exerting pressure toward an “El Niño-like” (EN) warming pattern (where the east warms faster than the west), a powerful natural cycle has been pushing the Pacific into a “La Niña-like” (LN) cooling phase. In the tug-of-war that has defined the last 40 years, nature has momentarily overpowered the influence of human emissions.
Analysis: This challenges the reflexive assumption that every local weather trend is a direct, linear manifestation of greenhouse gas emissions. It reveals a more nuanced reality: on a regional level, the Pacific’s own internal “noise” can be loud enough to drown out the signal of human-induced warming for decades at a time.
“These results indicate that unforced internal variability largely explains the satellite-era tropical Pacific change.”
3. Takeaway 2: The “Pacemaker” Experiment Proves Climate Models Aren’t Broken
To test if climate models were truly “broken,” the researchers conducted a “wind-stress pacemaker experiment” (CESM2-τ). In this simulation, they essentially “overrode” the model’s generated winds with real-world wind observations, specifically looking at the intensification of the Pacific Walker circulation—the vast loop of air that rises over the west and sinks over the east.
When the models were fed this actual wind data, the discrepancy vanished. The models suddenly “saw” and accurately simulated the cooling pattern observed since 1982.
Analysis: This provides a major restoration of confidence in climate science. It demonstrates that the underlying physics of our models—specifically the way they handle the interaction between the atmosphere and the ocean—are sound. The “failure” of the models to predict the cooling wasn’t a failure of physics, but a limitation of predictability. Models can tell us how the planet will react to more CO2, but they cannot yet predict the specific “coin flips” of natural wind shifts decades in advance.
4. Takeaway 3: The Deep-Sea Fingerprint (The Western Pacific Thermocline)
One of the study’s most technical and revealing insights is the discovery of a “subsurface fingerprint” located between 100 and 200 meters deep in the western tropical Pacific. In this specific layer, the thermocline—the boundary between warm surface water and the cold deep—has been deepening significantly.
Using “reduced gravity model” logic, the researchers explained why this is so significant. On short timescales (like a typical two-year El Niño), the thermocline acts like a seesaw, rising in one end of the ocean and falling in the other. However, on multidecadal timescales, the eastern Pacific’s response essentially “vanishes” due to complex wave dynamics. This leaves the deepening of the western thermocline as the only reliable “anchor” or fingerprint for long-term internal cycles.
Analysis: This vertical structure is a far more reliable indicator of climate shifts than surface temperatures alone. Because the ocean surface is constantly “contaminated” by atmospheric weather and direct solar heating, looking 200 meters down provides a cleaner, more stable record of the Pacific’s internal engine.
5. Takeaway 4: The Link Between the Pacific “Cold Wedge” and the Global Warming Hiatus
The cooling of the tropical Pacific had global consequences, most notably the “hiatus” or slowdown in global surface warming observed between 1998 and 2013. The study clarifies that the satellite era (1982–2024) happened to coincide with a major “negative phase transition” of the tropical Pacific decadal variability (tPDV).
During this period, the Pacific acted like a global air conditioner. This phase transition intensified the trade winds and activated the “ocean dynamical thermostat,” a mechanism where the ocean’s circulation helps regulate surface heat.
Analysis: The sheer scale of this 40-year excursion is a reminder of the Pacific’s dominance. This single cycle was powerful enough to mask the overall global warming signal for fifteen years. It teaches us that global warming does not move in a straight line; it moves in a series of steps and plateaus dictated by the phase of the Pacific.
6. Takeaway 5: This Cooling Trend is Likely Temporary and “Expected to Wane”
The researchers issue a clear warning: the cooling trend observed since 1982 is a phase, not a permanent new reality. These shifts are recurrent; the study points to the opposite transition that occurred during the “1970s Pacific climate regime shift,” which saw the ocean swing toward a warming phase.
As this cycle eventually “swings toward a positive phase,” the natural cooling that has moderated our temperatures for 40 years will cease. When that happens, the “mask” will be removed, and the underlying warming from greenhouse gases will likely return with a vengeance, potentially leading to a period of accelerated global heating.
Analysis: We must bridge our understanding of the past “hiatus” with a preparation for the future “surge.” If the negative phase of the tPDV gave us a reprieve, the coming positive phase will likely act as its mirror image—compounding human-caused warming with natural warming to create a sudden, dramatic shift in global conditions.
“As such, the LN pattern is expected to wane as tropical Pacific decadal variability transitions from its current negative phase, causing worldwide shifts in rainfall, tropical cyclones, and ocean-atmospheric circulations.”
7. Conclusion: The Wait for “Emergence”
The core takeaway from Shang-Ping Xie’s research is a lesson in patience and precision. In the tropical Pacific, the “noise” of nature is currently louder than the “signal” of human activity. However, that signal is not absent; it is lurking underneath. The study projects that the true human-forced warming trend—the one models have been predicting all along—may not clearly “emerge” from the noise of natural variability until the year 2047.
Closing Reflection: We are currently living through a 40-year “trend” that might actually be just one-half of a natural cycle. This raises a profound question for global policy: if our current climate adaptation strategies are based on the cooling we’ve seen since 1982, are we prepared for the whiplash when the cycle flips? Recognizing the difference between a temporary cycle and a permanent trend is the difference between being prepared for the future and being blindsided by it.
Xie, S.P., Miyamoto, A., Peng, Q. and Luongo, M.T., 2026. Major role for internal variability in tropical Pacific warming pattern over satellite era. Proceedings of the National Academy of Sciences, 123(36), e2615883123. https://doi.org/10.1073/pnas.2615883123
 Ocean to Climate
Leave a comment