
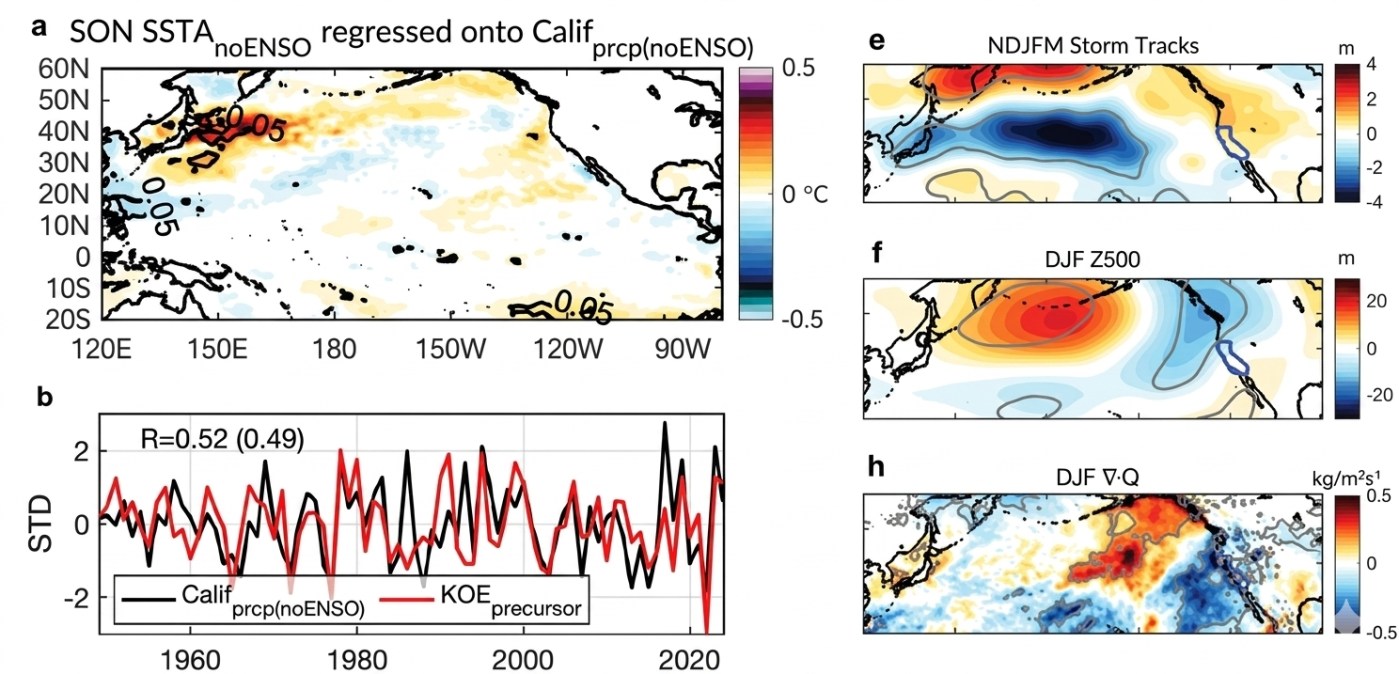
Reproduced from Figures 3 & 6 in Badezet-Delory (2026). (a) Regression of preceding September-November (SON) SST anomalies (°C), with tropical forcing removed, onto the ENSO-independent JFM California precipitation. (b) Comparison of the standardized timeseries of the ENSO-removed JFM California precipitation (black line) and the high-pass-filtered SON KOE precursor index (red line; cut off of 40 years). The correlation between the two-time series is shown in the upper-left corner, with the correlation using the unfiltered KOE precursor in parentheses. For panels (a) and (c), the contour indicates regions where regression coefficients are statistically significant at the 5% level. (e,f,h) Regression coefficients of winter atmospheric and oceanic variables onto the normalized SON KOE SST index from ERA5 data. Fields are averaged over DJF, except storm track activity in (e), which follows the conventional NDJFM definition for the North Pacific storm track. (e) NDJFM storm track activity defined as the root-mean-square of 2-6 day band-passed daily Z300 anomalies (m), (f)500-hPa geopotential height, Z500 (m), and (h) vertically integrated moisture flux divergence, ·Q (×10-5 kg m-2 s.-1). Gray contours indicate the significant regression coefficients at the 5% level based on a two-tailed Student’s t-test. The blue outline in (e,f,h) denotes the California state boundary.
This blog post and the “Deep Dive” podcast, created by Google Notebook, are based on “Kuroshio-Oyashio Extension Sea Surface Temperature Variability as a Precursor for Winter California Precipitation” by Badezet-Delory (2026).
This preprint by Badezet-Delory (2026) identifies a new predictive precursor for California’s winter rainfall by focusing on sea surface temperature fluctuations in the Kuroshio-Oyashio Extension (KOE) region of the North Pacific. While the El Niño-Southern Oscillation (ENSO) is traditionally used to forecast seasonal weather, its reliability has declined, as seen during the unexpectedly weak atmospheric response to the 2023/24 El Niño. The study demonstrates that autumn ocean temperatures in the KOE region influence downstream atmospheric patterns and storm tracks independently of tropical activity. By integrating this extratropical signal with standard tropical indices, researchers achieved a significant increase in the accuracy of precipitation models. These findings, validated by both historical records and high-resolution climate simulations, offer a more robust framework for managing water resources and flood risks in the Western United States.
The Hook: The Year the “Great” El Niño Failed
For decades, meteorologists and water managers have looked to the tropical Pacific to glimpse California’s hydroclimate future. The El Niño-Southern Oscillation (ENSO) is the “canonical” predictor, traditionally expected to dictate winter rain. However, the winter of 2015/16 served as a stark wake-up call. Despite a historically strong El Niño event in the tropics, the expected weather patterns across North America were surprisingly weak and inconsistent (Lee et al., 2018).
Why did this “Great” El Niño under-deliver? According to recent research, the answer lies in a complex interplay of atmospheric “interrupters,” including changes in tropical convection, Madden-Julian Oscillation (MJO) activity, and North Pacific variability. This underscores a frustrating reality: California resides in a low signal-to-noise regime. While ENSO broadly influences about a quarter of the interannual variance in California precipitation, the specific linear predictors traditionally used by forecasters (like the E-Index) actually only explain about 9%.
If the tropics aren’t providing the full picture, where should we look? New data suggests the answer lies far to the northwest, in a mid-latitude engine where the water’s “memory” holds the key to better forecasts.
Takeaway 1: The Kuroshio-Oyashio Extension (KOE) is the Secret Power Player
The study identifies a critical region in the Northwest Pacific mid-latitudes known as the Kuroshio-Oyashio Extension (KOE). This area, dominated by the western boundary current system, has emerged as a powerhouse predictor that operates independently of the tropics.
By analyzing historical records and high-resolution climate simulations, researchers discovered that sea surface temperature (SST) fluctuations in the KOE can signal California’s winter fate months in advance. This finding challenges the “tropical-centric” view, proving that mid-latitude ocean conditions are not merely reacting to the tropics—they are driving their own distinct climate signals.
“Specifically, we identify an ENSO-independent midlatitude SST precursor in the Kuroshio-Oyashio Extension (KOE) region, where autumn SST variability significantly precedes winter California precipitation anomalies.”
Takeaway 2: Autumn Temperatures Foretell Winter Floods
Timing is everything in seasonal forecasting. The study highlights a specific “precursor” window: ocean temperatures in the KOE region during the autumn months of September, October, and November (SON). These temperatures show a robust correlation with the precipitation California receives during the peak winter months of January, February, and March (JFM).
The secret to this lead time is ocean memory. Because of the ocean’s high heat capacity, the KOE acts as a thermal bank, storing heat signals in the autumn and releasing them to the atmosphere months later. This gives water resource managers a significant advantage in identifying high-risk seasons before the first major storm hits, allowing for better reservoir planning and flood risk mitigation.
Takeaway 3: Not All El Niños are Created Equal (The “Flavor” Problem)
One reason ENSO-based forecasts fail is that El Niño comes in different “flavors” depending on where the warmest water is located. However, the “Flavor Problem” is becoming more complex as the reliability of these indices shifts over time:
- E-Index (Eastern Pacific): This represents the “canonical” El Niño centered in the Eastern Pacific. It remains the more stable and reliable predictor for California precipitation in the historical record.
- C-Index (Central Pacific): This represents Central Pacific variability. The study found a pronounced declining trend in the relationship between the C-Index and California rain, meaning Central Pacific events are becoming less reliable indicators (though researchers note this trend is marginally significant at the 10% level).
Even the more stable E-Index is limited, explaining only about 9% of the variance on its own, which makes finding additional predictors like the KOE essential.
Takeaway 4: The “Atmospheric Bridge” and the North Pacific Storm Track
How does warm water off the coast of Japan affect rain in San Francisco? The connection is a physical “atmospheric bridge” driven by air-sea interactions.
When warm SST anomalies occur in the KOE region, they trigger enhanced turbulent heat fluxes (both latent and sensible heat). This massive upward transfer of energy from the ocean to the atmosphere increases low-level baroclinicity, which kicks the North Pacific storm track into a poleward shift.
This shift triggers a “ridge-trough wave train”—a series of high and low-pressure systems stretching across the Pacific. This wave train eventually creates moisture flux convergence over California, effectively funneling wetter conditions and “atmospheric rivers” directly toward the West Coast.
Takeaway 5: Two Predictors are Better Than One (The 32% Breakthrough)
The most significant finding for future forecasting is the power of the combined multilinear model. By pairing tropical and mid-latitude data, scientists achieved a major breakthrough in predictive power:
- ENSO Alone: Explains approximately 9% of the variance in California winter rain.
- Combined Model (ENSO + KOE): Explains approximately 32% of the variance.
This jump to 32% of the variance represents a “substantial benefit” for real-time seasonal forecasts. These findings were robustly reproduced in the SPEAR_HI_25 climate model. Crucially, the researchers noted that high-resolution modeling (at the 25km scale) is necessary to capture this signal; lower-resolution models (~100km) often fail because they cannot resolve the mesoscale eddies and fronts that make the KOE such a potent predictor.
Conclusion: A New Map for a Wetter, Drier Future
Incorporating mid-latitude “ingredients” like the KOE precursor provides a new map for interpreting California’s hydroclimate. By looking at both the tropics and the Northwest Pacific, forecasters can better understand why some El Niño years under-deliver while other years bring unexpected extremes.
However, challenges remain. Capturing these signals requires sophisticated, high-resolution modeling capable of resolving the complex oceanic processes of the Kuroshio-Oyashio system. As anthropogenic warming continues to shift the background state of the Pacific, potentially altering the jet stream and ocean temperatures, will these “hidden” ocean engines become our most vital tools for surviving California’s hydroclimate extremes? Understanding the KOE may be the difference between being blindsided by a drought and being prepared for a flood.
Badezet-Delory, I., Joh, Y., Delworth T. L. Di Lorenzo, E., & Johnson, N. C. Kuroshio-Oyashio Extension Sea Surface Temperature Variability as a Precursor for Winter California Precipitation, 04 September 2026, PREPRINT (Version 1) available at Research Square [https://doi.org/10.21203/rs.3.rs-10806223/v1]
Lee, S.-K., Lopez, H., Chung, E.-S., DiNezio, P., Yeh, S.-W., & Wittenberg, A. T. (2018). On the fragile relationship between El Niño and California rainfall. Geophysical Research Letters, 45, 907–915. https://doi.org/10.1002/2017GL076197


The correlation holds true only if the seasonal shift in the Pacific jet stream remains consistent across decades. This specific relationship does not apply to regions experiencing unusual oceanic heat waves.