
This blog post and the “Deep Dive” podcast, created by Google Notebook, are based on “The balance of evidence indicates a slowing AMOC” by Rahmstorf and Caesar (2026).
This preprint article compiles a heterogeneous body of evidence regarding the Atlantic Meridional Overturning Circulation, focusing specifically on latitudes south of 45°N The study examines continuous monitoring data alongside historical and paleoclimatic indicators to determine the long-term trajectory of ocean currents. Multiple analytical approaches—including temperature fingerprints, salinity patterns, and heat content metrics—point toward a consistent past and ongoing slowing of water movement. Although individual datasets present distinct uncertainties, the balance of observations strongly indicates that anthropogenic warming has driven a significant decline in circulation strength. Ultimately, the authors conclude that an AMOC slowdown is very likely occurring, emphasizing the necessity of sustained monitoring and proactive climate policy.
1. Introduction: The Myth of the Inconclusive Ocean Signal
The Atlantic Meridional Overturning Circulation (AMOC)—the massive system of ocean currents that acts as planetary climate infrastructure by delivering tropical heat to the North Atlantic—has dominated climate headlines in recent years. Yet, a persistent narrative in public discourse suggests that the scientific evidence regarding its decline remains “inconclusive.”
This perceived ambiguity stems largely from short-term observational records. Continuous direct monitoring from instruments like the RAPID array at 26°N has only been active since 2004. Over a two-decade window, distinguishing a permanent, human-driven slowdown from routine natural decadal variability is notoriously difficult.
However, a comprehensive synthesis of oceanographic physical data by Stefan Rahmstorf and Levke Caesar (2026) demonstrates that this perception of uncertainty is flawed. By restricting the spatial focus to latitudes south of 45°N—where northward surface flow and southward deep flow are vertically separated like a classic conveyor belt—and synthesizing multiple independent physical, chemical, and paleoclimatic datasets, a clear consensus emerges: the AMOC is systematically slowing down.
South of 45°N, stable density stratification prevents major mixing, ensuring that water flow remains dynamically continuous across ocean basins. North of 45°N, the circulation becomes far more complex: deep convection occurs, currents branch horizontally toward different formation regions, and deep water recirculates, creating localized signals that can temporarily anti-correlate with the broader circulation farther south. When scientists look south of this critical boundary, the underlying climate signal becomes remarkably clear.
Takeaway 1: The “Cold Blob” Paradox — Why One Patch of the Ocean Is Cooling While the Earth Warms
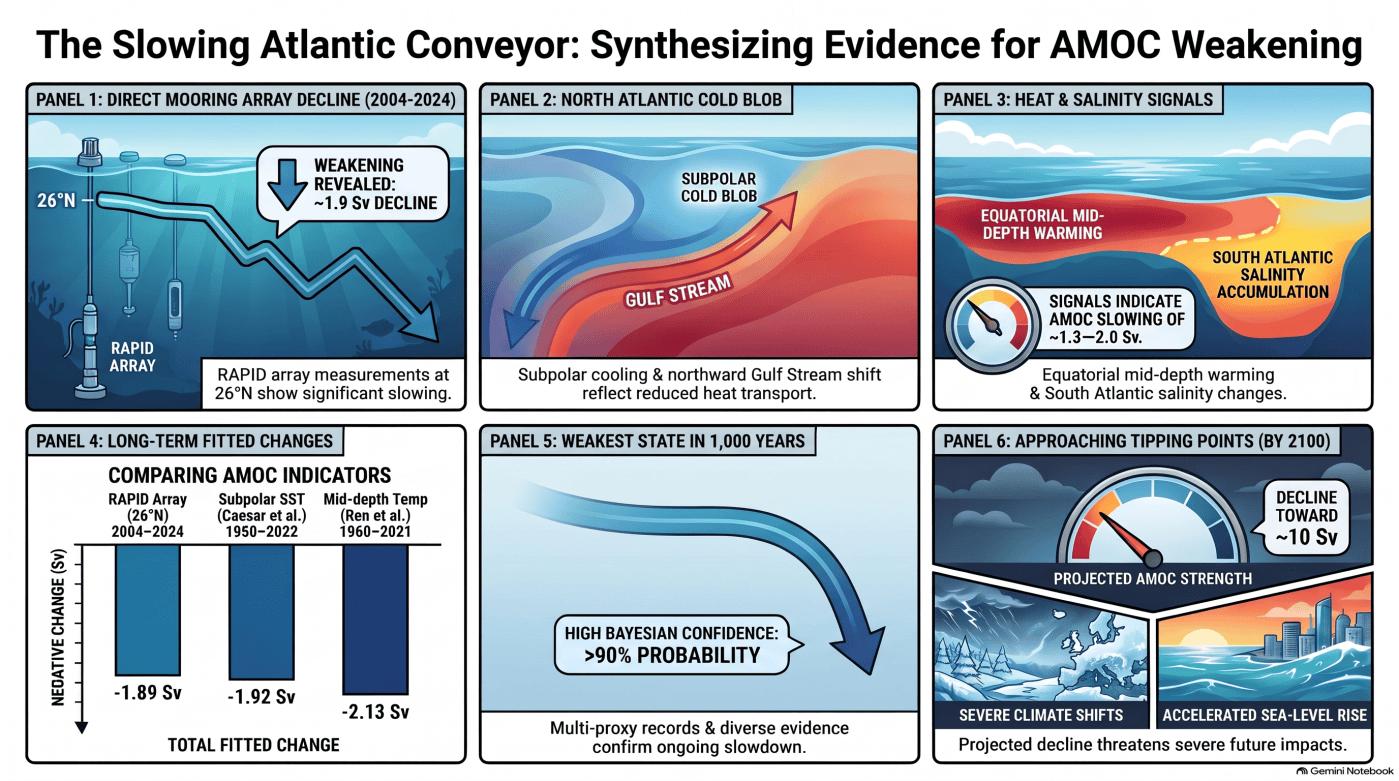
As greenhouse gas emissions drive global sea surface temperatures to historic highs, one specific region of the planet has stubbornly defied the global warming trend: the subpolar North Atlantic, located just south of Greenland. Known colloquially as the “cold blob” or “warming hole,” this patch of water has systematically cooled over more than a century.
This regional cooling is not a statistical anomaly; it is a direct physical consequence of a weakening AMOC transporting less ocean heat northward. The phenomenon is so prominent that it has been documented across successive Intergovernmental Panel on Climate Change (IPCC) reports since 2001 (spanning AR4, AR5, and AR6).
“While the global ocean has warmed, this region in the subpolar North Atlantic has not only resisted this trend but has cooled over more than a century, which could be explained by a decline of the AMOC’s heat transport.”
Driven by vorticity conservation, the slowing overturning also causes a corresponding northward shift of the Gulf Stream. Satellite altimetry data from 1993 to 2024 reveals a statistically significant (>95%) northward shift of 55 km, creating an adjacent zone of rapid warming along the North American eastern seaboard.
Analytical Reflection
The cold blob serves as a striking physical “fingerprint” of ocean circulation breakdown. While single atmospheric events can cause short-term sea surface temperature fluctuations, a century-long localized cooling trend amidst aggressive global surface warming cannot be explained by air-sea heat exchange alone; it requires a sustained reduction in oceanic heat transport from the tropics.
Takeaway 2: Hidden Fingerprints — Equatorial Mid-Depth Warmth and South Atlantic “Salinity Pile-Up”
Oceanographers are no longer relying solely on surface temperatures to track the AMOC. By examining subsurface heat storage and salinity patterns across opposite hemispheres, scientists have uncovered hidden signals deep within the ocean basin:
- Equatorial Mid-Depth Warming: Observations indicate a pronounced warming between 1,000 and 2,000 meters depth in the equatorial Atlantic (1°S–1°N) since 1960 (Ren et al., 2025). Because this layer is isolated from direct atmospheric surface forcing, it provides a clean signal for circulation changes, indicating an AMOC slowdown of approximately 2 Sv (where 1 Sv = 1 million m³/s) since the 1950s.
- South Atlantic Salinity Pile-Up: In the subtropical South Atlantic (300–500 meters depth), salt is accumulating (Zhu & Liu, 2020; Zhu et al., 2023). Because a healthy AMOC exports warm, salty water out of the South Atlantic into the North Atlantic, a slowing circulation causes salt to “pile up” in the south. This metric points to a ~2 Sv weakening since 1900, with data showing an accelerated decline in transport beginning in the 1980s.
“Observations reveal a robust mid-depth warming since 1960 that emerged from natural variability in the early 2000s…” — Ren et al. (2025)
Analytical Reflection
What makes these subsurface fingerprints so compelling is their spatial isolation from one another. Subpolar North Atlantic freshening can be influenced by local Arctic wind patterns, while South Atlantic salinity is subject to Agulhas leakage or Pacific atmospheric teleconnections. Because the non-AMOC noise drivers for these two regions are entirely different, their physical convergence on the exact same ~2 Sv rate of decline provides mutual validation across opposite sides of the equator.
Takeaway 3: Deep Ocean Waters Are Literally “Aging”
The AMOC acts as the ocean’s lungs, pulling surface water down into the deep ocean and supplying oxygen and atmospheric gases to the deep sea basin. When overturning slows, deep water renewal (ventilation) drops, causing deep ocean water to literally “age.”
Scientists quantify seawater age by measuring concentrations of abiotic chemical tracers—specifically chlorofluorocarbon-12 (CFC-12) and sulfur hexafluoride (SF6)—which entered the ocean exclusively through historical surface contact. Measurements taken from 1985 to 2021 demonstrate that deep North Atlantic waters are systematically aging (Guo et al., 2026), proving that fresh surface water is sinking less frequently.
“…the North Atlantic waters are generally aging, which is interpreted as evidence of reduced ventilation and a climate-change signal rather than natural variability.” — Guo et al. (2026)
A complementary approach for reconstructing overturning is the physics-based Water Mass Transformation (WMT) framework (Li et al., 2025). By integrating hydrographic observations of ocean temperature and salinity with atmospheric reanalyses and subsurface mixing estimates, the WMT framework provides a robust stream function calculation across the Atlantic basin.
| Diagnostic Method | Primary Indicator | Documented Decline Rate | Time Horizon |
| Abiotic Tracer Age (CFC-12, SF6) | Seawater age (surface ventilation time) | Systematic aging across North Atlantic | 1985–2021 |
| Water Mass Transformation (WMT) | Integrated hydrography & surface fluxes | 13% ± 2% (~2.4 Sv) decline at 26°N | 1980–present |
Analytical Reflection
Chemical tracer aging eliminates the ambiguity present in temperature-only records. While ocean temperature can be influenced by radiative forcing or surface wind anomalies, the accumulation of “older” water at depth is a direct physical confirmation of reduced deep ocean ventilation driven by anthropogenic climate change.
Takeaway 4: The AMOC Is Currently at Its Weakest Point in Over 1,000 Years
To understand whether current measurements represent routine historical fluctuations or a true anomaly, climate scientists rely on paleoclimate proxy data. By analyzing microplankton species abundances, oxygen isotope ratios (δ¹⁸O), and the grain sizes of “sortable silt” deposited beneath deep ocean currents, researchers have reconstructed AMOC transport over the past millennium (Rahmstorf et al., 2015; Thornalley et al., 2018; Osman et al., 2019; Caesar et al., 2021).
The historical timeline revealed by these multi-proxy reconstructions is striking:
- 400 AD – 1800 AD: Exceptional stability with minimal natural baseline fluctuations.
- 19th Century: An initial weakening trend begins following the end of the Little Ice Age.
- Mid-20th Century to Present: A sharp acceleration in weakening, bringing modern overturning transport to its lowest point in at least 1,000 years.
Analytical Reflection
Placing modern observational trends against a 1,000-year baseline invalidates the argument that the current slowdown is merely routine internal variability. The structural shift starting in the mid-20th century aligns directly with the rapid expansion of industrial greenhouse gas emissions and subpolar ocean freshening.
Takeaway 5: Why “Lack of Statistical Significance” Was Misunderstood (And How Bayesian Math Solves It)
A persistent issue in climate literature is the misinterpretation of statistical metrics. Several short-term datasets report AMOC trends that do not reach the standard 95% statistical significance threshold (p > 0.05). Critics have frequently cited these studies as “evidence against a slowdown.”
As statistician T.G. Shepherd (2021) highlighted, failing to reject a null hypothesis of “no trend” at the 95% level on a single short, noisy dataset is not proof that no trend exists; it simply means that single record cannot establish it independently.
“A slowing with p-value above 0.05 indicates that the null hypothesis of no trend cannot be rejected at the conventional 95% significance threshold; that is less conclusive evidence for AMOC slowing, but it is not evidence against it.” — Rahmstorf & Caesar (2026)
When evaluated through a Bayesian probability framework, these isolated uncertainties dissolve by synthesizing multiple lines of evidence:
- Prior Baseline: Start with a conservative, skeptical 50% prior probability that the real-world AMOC has slowed since 1993.
- First Evidence Stream (Cold Blob): Observing the subpolar cooling patch updates the posterior probability of a slowdown to 69% (“likely” in IPCC terms).
- Second Independent Stream (Salinity Pile-Up): Incorporating South Atlantic salinity accumulation pushes the total cumulative probability to >90% (“very likely” in IPCC terms).
This statistical reconciliation is further reinforced by global ocean reanalyses. A comprehensive analysis of 14 ocean reanalysis products (Winkelbauer et al., 2026) revealed a unanimous negative trend in Atlantic ocean heat transport at 26°N between 1993 and 2023, translating to an AMOC reduction of 2 to 5 Sv (1.23 ± 0.57 Sv per decade) over the last three decades.
Analytical Reflection
Hyper-fixating on single observational datasets creates a false narrative of scientific disagreement. When atmospheric reanalyses, subsurface heat content, tracer aging, density trends, ocean reanalyses, and paleoclimate proxies are evaluated synthetically using Bayesian logic, the combined probability of an ongoing AMOC slowdown overwhelmingly exceeds the threshold for scientific confidence.
Takeaway 6: The Real-World Consequences — Tipping Points, Sea Levels, and European Weather
Direct basin-wide monitoring at 26°N via the RAPID array reveals a weakening trend of -0.95 Sv per decade (~1.9 Sv overall) between 2004 and 2024. Even more dramatically, mooring arrays measuring the deep western overturning transport at 26°N show a highly significant decline of 2.6 ± 0.7 Sv per decade over 2004–2023 (Xing et al., 2026), demonstrating consistent weakening across key physical ocean components.
State-of-the-art climate models project that continued emissions could push the ocean’s overturning transport from its historical average of ~17 Sv down to ~10 Sv by the year 2100 (Portmann et al., 2026). This magnitude of decline brings the circulation dangerously close to a critical tipping point threshold, beyond which the AMOC could suffer an irreversible collapse.
The tangible real-world impacts of an ongoing AMOC decline include:
- Dynamic Regional Sea-Level Rise: Accelerated sea-level height increases along the North American eastern seaboard and European coastlines.
- Hydroclimate Disruptions: Major shifts in global precipitation belts, altering tropical monsoon systems and increasing drought risks across major agricultural zones.
- European Climate Shift: Severe cooling trends across Northwestern Europe, altering atmospheric storm tracks and counteracting global surface warming locally in complex, disruptive ways.
To manage these systemic threats, Rahmstorf & Caesar outline three crucial policy and scientific imperatives:
- Expand Monitoring: Sustain existing short-term arrays and upgrade them into a permanent, coordinated international ocean early-warning observatory.
- Adaptation Planning: Formally integrate AMOC slowdown and potential collapse scenarios into long-term regional climate adaptation and infrastructure plans.
- Emissions Reductions: Rapidly reduce fossil-fuel usage and greenhouse gas emissions to limit further warming and avoid crossing an irreversible planetary tipping point.
8. Conclusion: Listening to the Ocean’s Warning
Risk management in human society never requires 100% absolute certainty before taking preventive action—especially when dealing with non-linear, high-impact, and irreversible planetary systems.
The physical metrics are overwhelmingly consistent: surface temperature fingerprints, deep ocean salinity pile-ups, chemical water mass aging, 14-product reanalysis consensus, and millennial-scale proxy records all point to an Atlantic overturning circulation that is demonstrably losing momentum under anthropogenic climate forcing.
As oceanographic monitoring systems confirm that the conveyor belt is weakening, a central question remains for global policy: Will we wait for absolute statistical certainty after a planetary tipping point has already been crossed, or will we act on the clear probabilistic warnings the ocean is providing today?
Rahmstorf, S. and Caesar, L., 2026. The balance of evidence indicates a slowing AMOC. arXiv preprint arXiv:2611.23429. Available at: https://arxiv.org/abs/2611.23429.


Leave a Reply