
This blog post and the “Deep Dive” podcast, created by NotebookLM, are based on “Dynamically downscaled future projections of the Northwest Atlantic Ocean across low to high emissions scenarios” by Kim et al. (2025).
This paper evaluates future changes in the Northwest Atlantic Ocean by using a high-resolution regional model to refine global Earth system model projections. By employing dynamical downscaling, the authors successfully corrected historical biases and provided more accurate simulations of the Gulf Stream and other critical boundary currents. Examining four different emission scenarios, the study reveals that a projected weakening of the Atlantic Meridional Overturing Circulation (AMOC) and the associated Western Boundary Current system will drive significant increases in coastal temperature, salinity, and sea levels, while reducing the upwelling of cold, nutrient-rich deep water vital to marine life. These findings highlight the South Atlantic Bight as a potential hotspot for rising sea levels, intensified flooding risks, and declining marine ecosystems and fisheries. Ultimately, the results demonstrate that while significant ocean changes are likely, their severity remains highly sensitive to future greenhouse gas emissions.
1. A Coastline in Transition
The Northwest Atlantic is one of the most complex and high-stakes marine environments on the planet. Stretching from the historic cod and lobster grounds of New England to the vibrant coral reefs of Florida, this region supports a multi-billion-dollar blue economy. However, it is also warming two to three times faster than the global average, placing both marine ecosystems and coastal infrastructure under unprecedented stress.
For years, scientists have relied on global climate models to peer into the future, but these tools were often too “blurry” to capture the fine-scale dynamics of coastal currents. Enter MOM6-NWA12, a new high-definition regional model. By resolving features like ocean eddies and shelf-scale circulation, this model acts as a high-resolution lens, revealing a future that older, coarser models largely missed. As the great “ocean conveyor belts” off our shores begin to falter, the data suggests we are approaching a fundamental reorganization of the Northwest Atlantic. What happens to our cities and our seas when the very plumbing of the ocean begins to fail?
2. The Case of the Disappearing Current
One of the most startling projections from the MOM6-NWA12 model concerns the Antilles Current. Historically a reliable component of the Western Boundary Current system, this current is projected to face a near-total collapse. Under the high-emissions SSP-585 scenario, the mean transport of the Antilles Current is expected to drop from its historical average of 3.4 Sverdrups (Sv) to nearly zero—and potentially even reverse to -0.72 Sv—by approximately 2080.
This is not merely a minor slowdown; it represents a structural rerouting of the Atlantic’s plumbing. The study observes:
“This weakening (and the reversal) of the Antilles Current… may play a key role in the subtropical gyre recirculation and the upper-ocean stratification in the [South Atlantic Bight].”
When a primary current effectively disappears or turns back on itself, it alters the fundamental layering of the ocean, changing how heat and salt are distributed across the entire eastern seaboard.
3. The 2070 “Lock-In”: Our Shared Near-Term Destiny
A critical finding of the research is the “insensitivity” of ocean currents to different emissions scenarios over the next several decades. Whether the world follows a path of aggressive carbon mitigation (SSP-126) or continues with high emissions (SSP-585), the weakening of the Western Boundary Currents remains nearly identical until roughly 2070.
This reveals a sobering “delayed ocean response.” While our actions today are vital for determining the state of the world after 2070, our near-term fate is largely set by historical inertia. The Atlantic Meridional Overturning Circulation (AMOC) and its associated currents are responding to forcing that has already occurred. For coastal planners, this means that the next few decades of oceanic change are already “locked in,” regardless of current policy shifts.
4. The South Atlantic Bight: A Global Sea-Level Hotspot
While much of the conversation around sea-level rise focuses on melting ice, the MOM6-NWA12 model highlights “dynamic” sea-level rise—changes caused by shifting ocean currents. The model identifies the South Atlantic Bight (SAB)—the coastal region from North Carolina to Florida—as a global hotspot.
The projections show a dramatic contrast between regions:
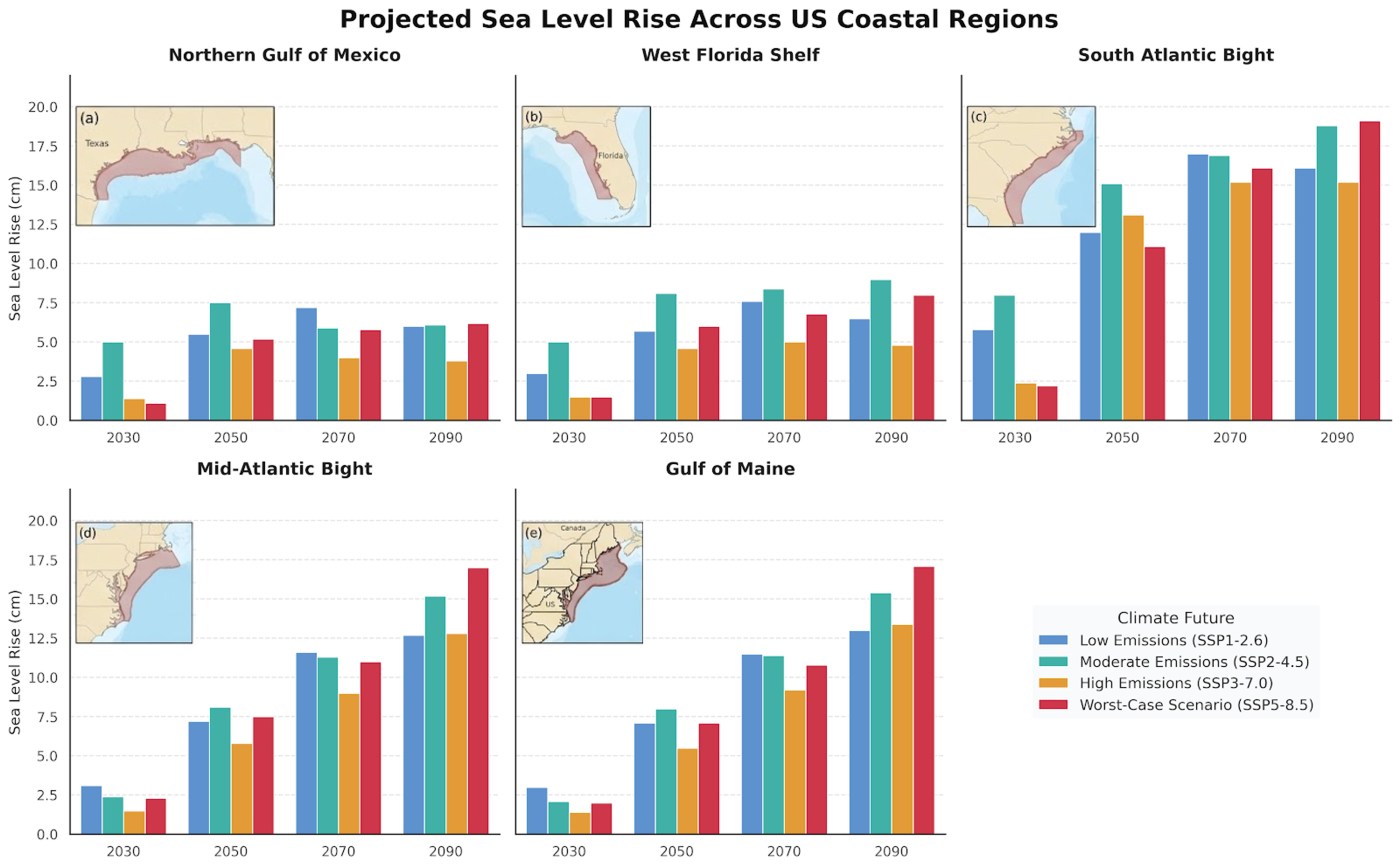
- Gulf of Mexico: Projected dynamic sea-level rise of a modest 5 to 7 cm.
- South Atlantic Bight: Projected dynamic rise of approximately 20 cm by the late 21st century.
The model reveals a direct inverse relationship: for every 1 Sv reduction in the Florida Current’s transport, the sea level in the SAB rises by 1.7 cm. This is a “double whammy”; this redistribution of water mass will add to the global sea-level rise caused by melting glaciers. In the high-emissions SSP-585 scenario, this dynamic shift alone could account for 25% of the total sea-level increase.
5. Why “High Resolution” Changed the Forecast
The shift from the older GFDL-ESM4.1 (coarse) model to the high-resolution MOM6-NWA12 has fundamentally changed the forecast. Coarse models often struggled with “warm biases” and failed to accurately simulate where the Gulf Stream separates from the U.S. coast. Even with the improved “HD” lens of MOM6-NWA12, scientists acknowledge remaining challenges, such as a slight southward shift bias in the Gulf Stream’s separation point compared to observations.
However, by resolving “eddies” and “shelf-scale circulation,” the high-resolution model revealed much more extreme localized warming. In the Mid-Atlantic Bight (MAB), the new model projects temperatures could surge by up to 4°C—a figure older models underestimated. This is driven by a shoreward shift of the Gulf Stream and a critical failure of the north-to-south “cold water supply.” As the Labrador Current weakens, its cold, fresh water fails to reach the MAB, leaving the region at the mercy of the encroaching, warmer Gulf Stream. For fisheries, this is the difference between a manageable shift and a crisis for species like cod and lobster.
6. The “Double Whammy”: Heat and Stagnation
The weakening of the Florida Current does more than raise the water level; it changes the very chemistry of the coast. Currently, the “tilt” of ocean density layers (isopycnals) is maintained by the current’s motion—a principle known as geostrophy. As the current weakens, these layers “flatten out” or relax.
This isopycnal flattening effectively shuts off the “nutrient tap.” The result is a coastal ocean that is not only warmer but also saltier and more stagnant. Without the constant injection of cold, nutrient-dense subsurface water provided by current-induced upwelling, the biological engines that sustain regional fisheries are at risk of stalling. The sea becomes a more stratified, less productive environment.
7. Conclusion: The Long View
The Northwest Atlantic serves as a sentinel for global change. The findings from the MOM6-NWA12 model demonstrate that the future of our coastlines is written in the physics of the water itself. We are losing the literal slope of the ocean; as the currents slow and the water flattens, the sea is pushed toward our shores.
While global efforts to reduce emissions are essential for the 22nd century, the next several decades will require a robust commitment to adaptation. As we look toward 2070 and beyond, we must confront a difficult question: How can coastal communities adapt to a sea-level rise that is driven not just by the volume of the ocean, but by the very slowing of its motion?
Figure 13 from Kim et al. (2026): Spatially averaged sea level changes (cm) from historical period (1993–2020) in (a) the northern Gulf of America, (b) West Florida shelf, (c) the South Atlantic Bight, (d) the Middle Atlantic Bight, and (e) the Gulf of Maine under the SSP-126 (blue bars), SSP-245 (cyan bars), SSP-370 (orange bars) and SSP-585 (red bars) simulations. The dynamic sea level changes are spatially averaged over the shelf regions below 200 m depth (brown-colored area in the maps). The years on the x-axis represent the center of a 20-year averaging period (e.g., the value for 2030 represents the average from 2021–2040).
Kim, D., Ross, A. C., Shin, S.-I., Gomez, F. A., John, J. G., Volkov, D. L., Lee, S.-K., Alexander, M. A., and Stock, C. A.: Dynamically downscaled future projections of the Northwest Atlantic Ocean across low to high emissions scenarios, Ocean Sci., 22, 1987–2009, https://doi.org/10.5194/os-22-1987-2026, 2026.

Leave a comment