
Key factors that affect regional coral bleaching have been well studied and documented. These include extreme warm temperatures, the duration of extreme cold temperatures, and temperature bimodality (i.e., the exposure of corals to two distinct temperature regimes). However, some of these factors are more important than others in different regions because there are complex and interactive responses to thermal stresses that are modified by regional biological and environmental conditions. A study published in Nature Climate Change explored the global coral breaching events at 226 sites and 26 environmental variables that represent different mechanisms of stress responses during the 2014–2016 El Niño/Southern Oscillation thermal anomaly. The study found that commonly used thermal threshold indices, such as the common degree-heating week temperature index, could explain only up to 9% of the coral breaching variance. This study tested a new multivariate index that includes the duration and temporal patterning of hot and cold temperature extremes relative to average local conditions, and found that the new index could explain up to 50% of the coral breaching variance. Thus, the study proposed the multivariate method to better monitor and predict future global coral breaching events.
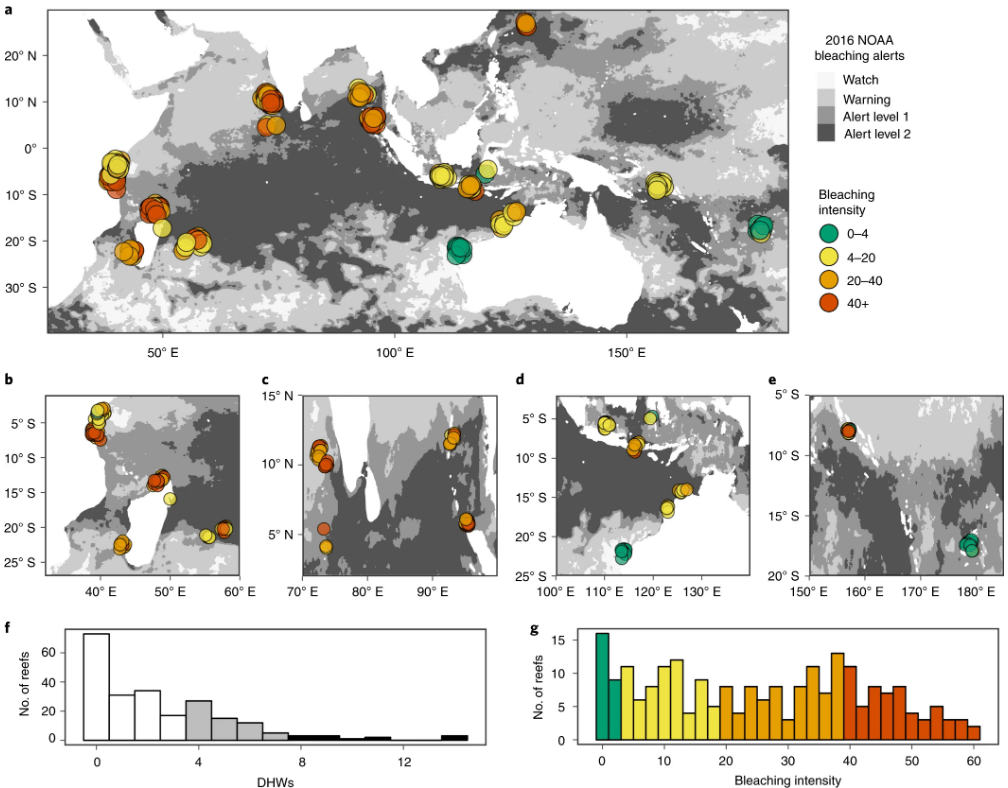
Figure 1 from McClanatha et al. (2019): Indo-Pacific scale and severity of coral bleaching during the 2016 El Niño/Southern Oscillation event: a, The severity of coral bleaching at 226 sites in 12 countries measured from standardized underwater surveys (n = 60,591 coral colonies) during the peak of the warm season. Higher bleaching intensity scores indicate more frequent and severe bleaching. The grey scale indicates the NOAA bleaching alert levels at each site in 2016. b–e, As in a but for Western Indian Ocean (b), Eastern Indian Ocean (c), Australia–Indonesia (d) and eastern Melanesia (e). f, Frequency distribution of 2016 maximum degree-heating weeks (DHWs) in the 90 days before each survey. g, Frequency distribution of bleaching intensity scores for the 226 sites (colour key as in a).
McClanatha, T. R. et al. (2019) Temperature patterns and mechanisms influencing coral bleaching during the 2016 El Niño. Nature Climate Change, https://doi.org/10.1038/s41558-019-0576-8.

Leave a comment