
This blog post and the “Deep Dive” podcast, created by NotebookLM, are based on “North Pacific model biases influence Kuroshio Extension atmospheric circulation patterns” by Song et al. (2026).
A new research by Song et al. (2026) explores how sea surface temperature (SST) biases in climate models disrupt the predicted atmospheric circulation patterns caused by the Kuroshio Extension (KE). By comparing satellite data with various CMIP6 HighResMIP simulations, the authors found that warm ocean anomalies typically drive local evaporation and heating that influence weather across the North Pacific. However, many models contain a cold bias in the region, which weakens the simulated latent heat flux and leads to inaccurate atmospheric responses. Interestingly, simply increasing model resolution does not fix these issues, as structural errors in the models persist regardless of detail. The study concludes that reducing regional SST biases is more critical than increasing resolution for improving the reliability of decadal climate forecasts and future projections.
The North Pacific is governed by a restless energy that dictates climate patterns across the hemisphere. At the heart of this system lies the Kuroshio Extension (KE), a massive, vigorous eastward jet flowing off the coast of Japan. It is a powerful “invisible hand” that shapes the Pacific on decadal timescales, influencing everything from the path of storms hitting the North American West Coast to the productivity of marine ecosystems.
To predict these decadal shifts, we rely on sophisticated numerical models. Yet, a persistent mystery remains: even our most advanced simulations often fail to capture the atmospheric ripple effects of the Kuroshio Extension. New research published in Geophysical Research Letters reveals that the problem isn’t a lack of raw computing power, but a fundamental “cold bias” in how models simulate the ocean’s interaction with the sky.
The Kuroshio as an Atmospheric Architect
The Kuroshio Extension is more than just a current; it is a dynamic system that swings between “stable” and “unstable” regimes over several years.
During its stable phase, the KE isn’t just a river in the sea—it transforms into a powerhouse. It is characterized by a northward shift of the jet, an enhanced southern recirculation gyre, and stronger eastward transport. This configuration creates a massive reservoir of upper-ocean heat.
This isn’t just an oceanographic curiosity. These shifts alter the thermal structure of the North Pacific, creating an “ocean-atmosphere coupled pathway.” This feedback loop essentially allows the ocean to write a blueprint for the winds, steering the extratropical storm tracks that eventually reach distant shores.
The Engine of the North Pacific: Why Local Evaporation Rules the Skies
How does a warm patch of ocean move the air miles above it? The secret is the “ocean’s breath,” technically known as latent heat flux (LHF).
When the Kuroshio-Oyashio Extension (KOE) region warms, it triggers a surge in surface evaporation. As this moisture rises, it condenses and releases energy—a process called diabatic heating. The researchers found that this heating is most critical at the 850-hPa level in the lower troposphere. This “bottom-up” heating acts as a thermal engine, driving the atmospheric circulation patterns that govern the entire basin.
The research team identified this mechanism as the “smoking gun” for how the ocean steers the atmosphere. In their words:
“Observational KE regression patterns show that warm sea surface temperature (SST) anomalies over the Kuroshio‐Oyashio Extension (KOE) enhance local surface evaporation and lower‐tropospheric diabatic heating, accompanied by downstream cyclonic circulation anomalies over the North Pacific.”
The “Cold Bias” Trap: When Models Lose the Thread
The study, which analyzed seven global coupled climate models and 17 different simulations, uncovered a startling “trap” that breaks the logic of our climate forecasts. This is known as the Cold SST Bias.
In many coupled models, the simulated ocean over the KOE region is depicted as colder than reality. While the multi-model average bias is small, individual models show wild deviations ranging from a chill of -1.67∘C to a warmth of 2.26∘C. This error creates a catastrophic cascade:
- A Muffled Signal: The cold bias prevents the model from simulating enough evaporation (LHF).
- The Broken Engine: Because the “breath” of the ocean is too weak, the model fails to generate the necessary diabatic heating at the 850-hPa level.
- The Wrong Forecast: Without that heating, the model simply cannot produce the cyclonic circulation patterns that actually occur in nature.
Interestingly, this is a “trap” unique to coupled models. Atmosphere-only models often seem accurate because they use “prescribed” sea surface temperatures—essentially feeding the model the right answers from the start. But when we ask a coupled model to simulate both the ocean and the sky simultaneously, the underlying SST biases emerge and lead the atmospheric forecast astray.
Resolution is Not a Silver Bullet
In climate science, we often assume that “more pixels = more accuracy.” This was the hope for the High-Resolution Model Intercomparison Project (HighResMIP). However, the data shows that increasing resolution from 100 km down to 10 km does not consistently fix these SST biases.
Even the sharpest models carry “structural issues.” The research suggests that the problem lies in the underlying physics of the models—specifically, how they handle parameterizations and the representation of cloud radiative effects. Raw computing power cannot override a flawed physical blueprint; a high-resolution model with a cold bias will still fail to capture the North Pacific’s atmospheric dance.
The Cyclonic Ripple Effect
When the Kuroshio Extension enters its stable phase, it creates a specific atmospheric signature that ripples across the Pacific. By filtering out “noise” from the tropics—such as signals from El Niño—the researchers proved that the KE has its own independent power to shape the following patterns:
- Anomalous Equivalent-Barotropic Cyclonic Circulation: A robust low-pressure signature that extends through the atmospheric column.
- Lower-Tropospheric Reinforcement: 925-hPa winds that reinforce the background northwesterly flow.
- Storm-Track Deflection: A significant southward deflection of storm-track activity, fundamentally altering where energy is deposited across the basin.
Beyond the Pixel
To fix our climate forecasts, we must look beyond the resolution of the screen. This research proves that addressing persistent, structural SST biases is more vital than simply throwing more “pixels” at the problem.
As we navigate an era of increasing climate volatility, it raises a critical question: should we value a model for its visual sharpness, or for how accurately it understands the fundamental breath of the ocean? If we want to know what the North Pacific has in store for us a decade from now, the answer lies in fixing the physics, not just the resolution.
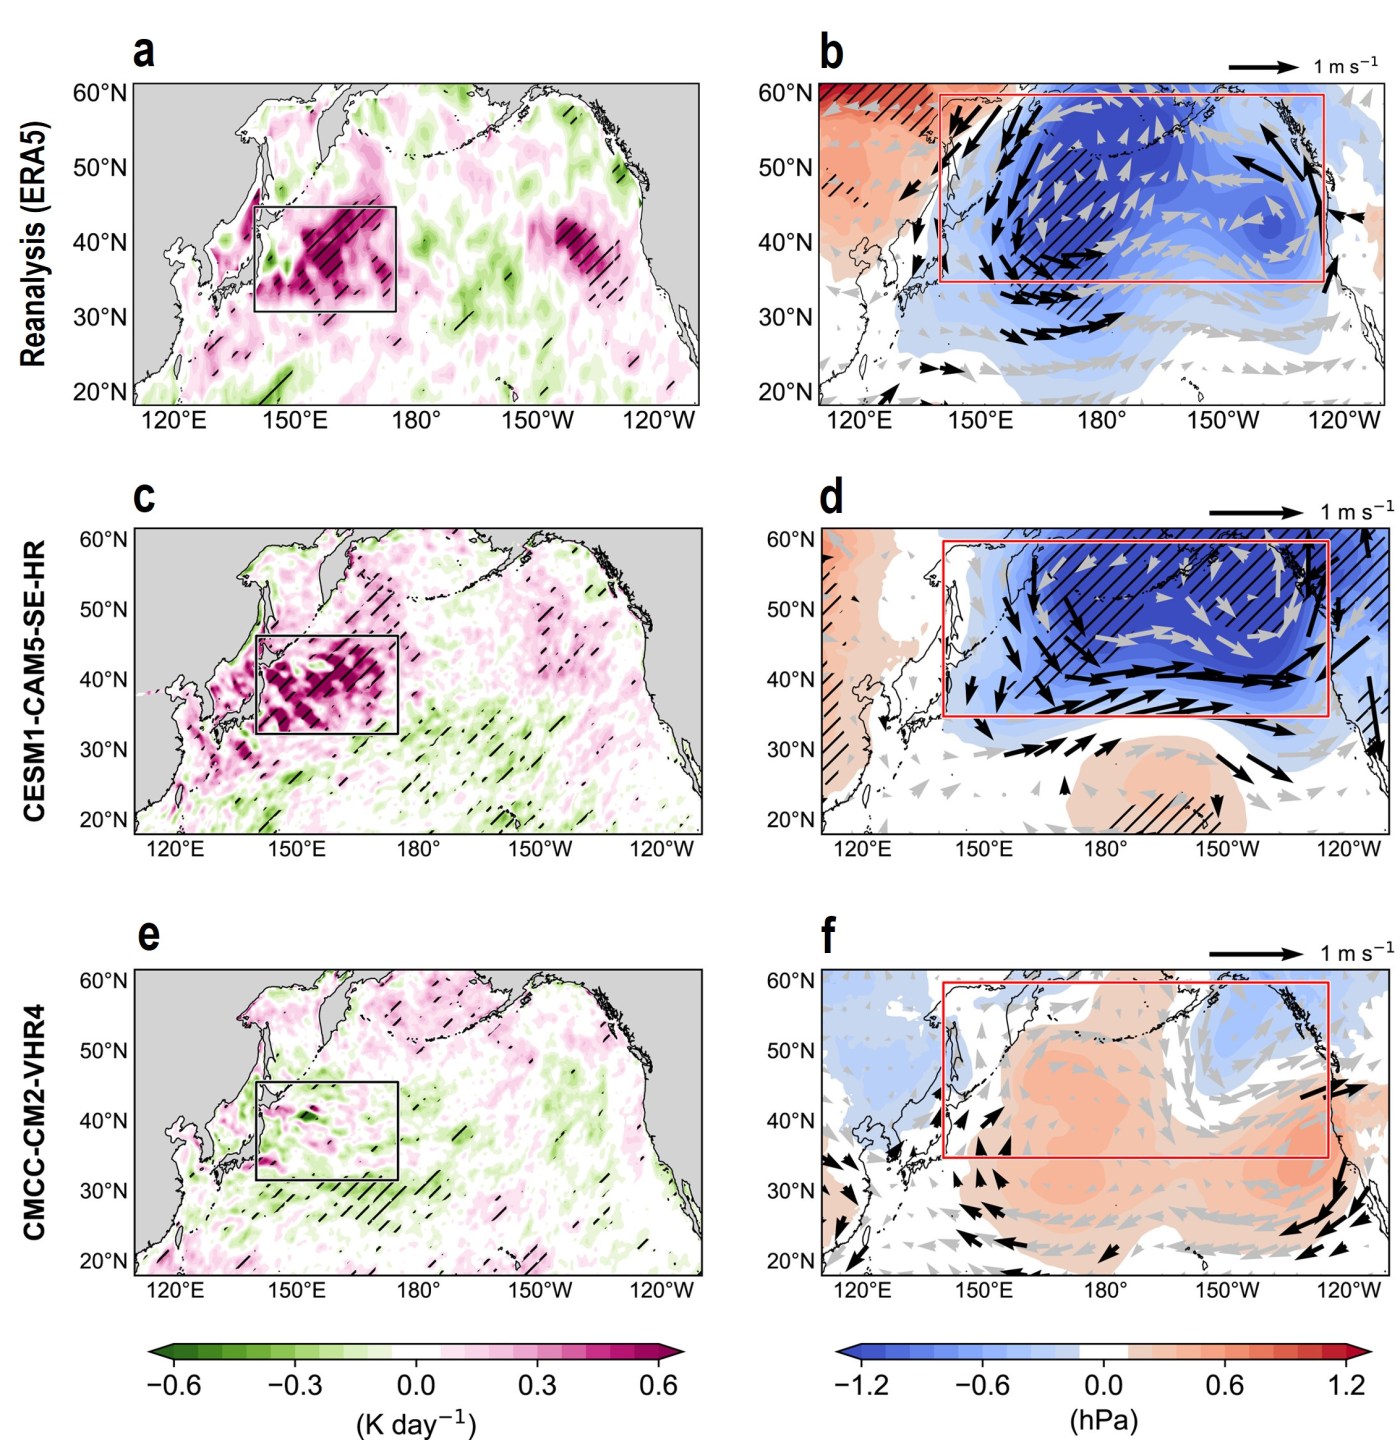
Figure derived from Figures 1 and 2 in Song et al. (2026). (a-b) Observed atmospheric circulation patterns of the Kuroshio Extension (KE) variability for 1993–2022. Regression of (a) atmospheric diabatic heating at 850 hPa (K day−1), and (b) sea level pressure (shadings, hPa) and 925 hPa wind (vectors, m s−1) anomalies during DJ (December–January) onto the SON KE index. (c-f) Representation of the atmospheric circulation patterns of the Kuroshio Extension (KE) variability in Coupled Model Intercomparison Project Phase 6 High Resolution Model Intercomparison Project (HighResMIP) models. (c, d) Regression of (c) atmospheric diabatic heating at 850 hPa (K day−1) and (d) sea level pressure (shadings, hPa) and 925 hPa wind (vectors, m s−1) anomalies during DJ onto the SON KE index for 1950–2014 from CESM1-CAM5-SE-HR. (e, f) Same as (c, d) but from CMCC-CM2-VHR4. The black box in panels (a,c,e) and the red box in panel (b,d,f) indicate the Kuroshio-Oyashio Extension domain (31°N–45°N, 140°E–175°E) and the North Pacific domain (35°N–60°N, 140°E–125°W), respectively. Hatching (for shaded quantities) and black vectors (for wind) denote regions where the regression is statistically significant at the 90% confidence level.
Song, S.‐Y., Stevenson, S., Di Lorenzo, E., Newman, M., Capotondi, A., & Schneider, N. (2026). North Pacific model biases influence Kuroshio Extension atmospheric circulation patterns. Geophysical Research Letters, 53, e2025GL118765. https://agupubs.onlinelibrary.wiley.com/doi/10.1029/2025GL118765

Leave a comment