
The warming response of the upper atmosphere is much stronger in the tropics due to higher water vapor content and frequent deep tropical convection that maintains the atmosphere column well-mixed. As a result, the zonal jet strength, which is largely proportional to the meridional gradient of atmosphere temperature via “thermal wind relationship” is projected to increase in the future. However, due to the influence of Arctic amplification, the lower atmospheric zonal wind may not follow the increasing trend in the upper atmosphere. In fact, some studies argue that the polar jet may actually weaken in the future largely due to Arctic amplification increasing the amplitude of weather patterns and stalling their progressions. This may lead to an increased probability of extreme weather events that result from prolonged conditions, such as drought, flooding, cold spells, and heat waves. In a study published in the Proceedings of the National Academy of Sciences (PNAS), Matthew Osman and his team analyzed the North Atlantic surface zonal wind variation of the past and future using snowfall records from Greenland ice cores and climate model projections for the future. In summary, this study found that the current state of the North Atlantic zonal winds is well within the range of natural variations during the past 1250 years, despite dramatic warming across recent decades. However, the North Atlantic zonal winds will get slightly more intense, the number of extremes (i.e., outside the historical range of intensity) will increase, and the latitudinal position of the maximum zonal winds (the core latitude of the North Atlantic westerlies) will shift northward as much as 2 degree by 2100. These findings have important implications for weather, climate, ocean circulations and marine ecosystems in the future.
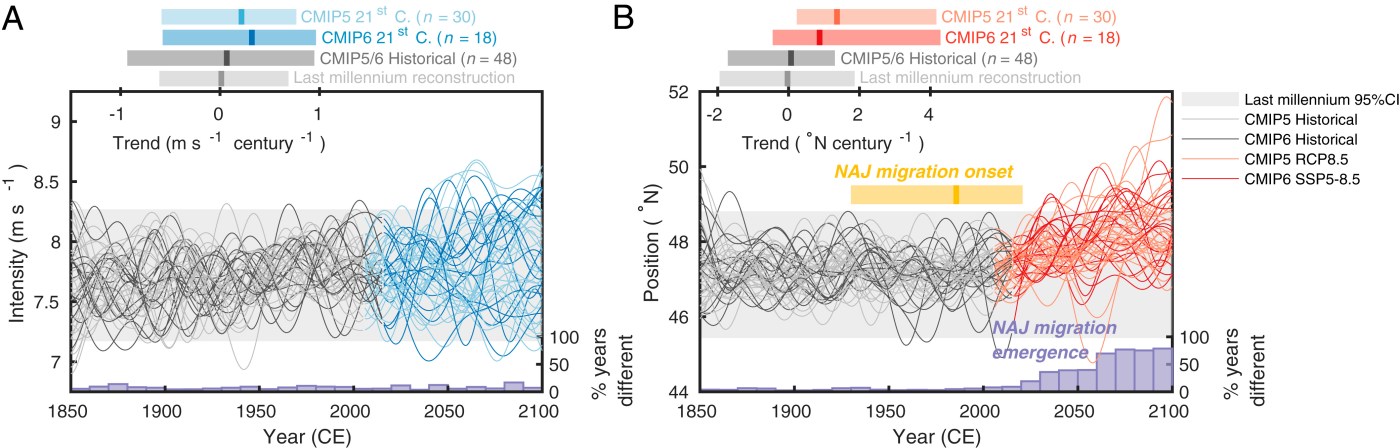
Figure 4 in Osman et al. (2021). Projected North Atlantic Jet (NAJ) intensity and position changes under high-emissions scenarios. CMIP-modeled mean annual NAJ intensity (A) and position (B) for the RCP8.5 and SSP5-8.5 emissions scenarios, smoothed for visualization at 30-y low-pass resolution. All CMIP5 and CMIP6 model runs are recentered to have the same mean NAJ intensity and position as the NOAA20C reanalysis between 1900 and 2000 CE. Shown for comparison (light gray shading) is the reconstructed range (95% CI) of (30-y low-pass) NAJ intensity and position during the last 13 centuries. The cross-model onset timing for sustained, significant (P< 0.05) northward NAJ migration (SI Appendix) is shown in yellow (median and 95% CI range; n = 48) in B. Projected 21st century NAJ position and intensity trends (median and 95% CI range) are shown relative to the last millennium (all 100-y periods) and CMIP-historical period (1850 to 2005 CE), at the top. Shown at the bottom in purple is the percent of years per decade whose CMIP-modeled NAJ position and intensity are significantly different (P< 0.05) than the NAJ position and intensity range exhibited by the reconstruction.
Osman, M. B., Coats, S., Das, S. B., McConnell, J. R., & Chellman, N. (2021). North Atlantic jet stream projections in the context of the past 1,250 years. Proceedings of the National Academy of Sciences, 118 (38) e2104105118. https://doi.org/10.1073/pnas.2104105118
PBS video podcast episode “Is THIS the Real Reason Weather is Getting Wilder?“

Leave a comment