
The Atlantic Meridional Overturning Circulation (AMOC) transports warm and salty upper ocean water to the subpolar North Atlantic where the upper ocean releases some heat to the atmosphere. Due to the surface cooling and the high salinity (i.e., salty), the upper ocean water becomes heavier and thus sinks down to the deep ocean and then is carried southward. However, if the ice-melting from Greenland, due to anthropogenic global warming, exceeds a critical level and continues for a long period, the associated freshwater from the ice melting will make the upper ocean much lighter reducing the sinking of the upper ocean water and thus the AMOC. The weakened AMOC in turn transports less salt to the subpolar North Atlantic and thus amplifies the salt deficit. This so-called salt-advection feedback may lead to a complete shutdown of the AMOC. Henry Stommel (1961) demonstrated this cascade mechanism using simple temperature and salinity equations and the equation of state (i.e., ocean density as a function of temperature and salinity). Although Stommel’s study supports the possibility of a complete shutdown of the AMOC in the future, it has not been demonstrated using the current state-of-the-art climate models. A new study co-authored by Henk Dijkstra, a well-known theoretician and physical oceanographer, showed that a complete shutdown of the AMOC due to the salt-advection feedback does occur in a fully coupled General Circulation Model (CESM1). In their model experiment, the freshwater flux forcing is added to the subpolar North Atlantic at a rate of 3 × 10⁻⁴ Sv year−1 until the model year 2200, where a maximum flux of 0.66 Sv is reached. Despite the slow change in the freshwater forcing, the simulated AMOC rapidly transitioned from ~ 10 Sv to a complete shutdown within 100 years. The study further showed that the freshwater transport from the South Atlantic Ocean is the key to early detection of the potential shutdown, stressing that “Sustained future section measurements (available since 2009) at 34°S from the SAMoc Basin-wide Array (SAMBA) are therefore of utmost importance and will become crucial to estimate the distance to an AMOC collapse“.
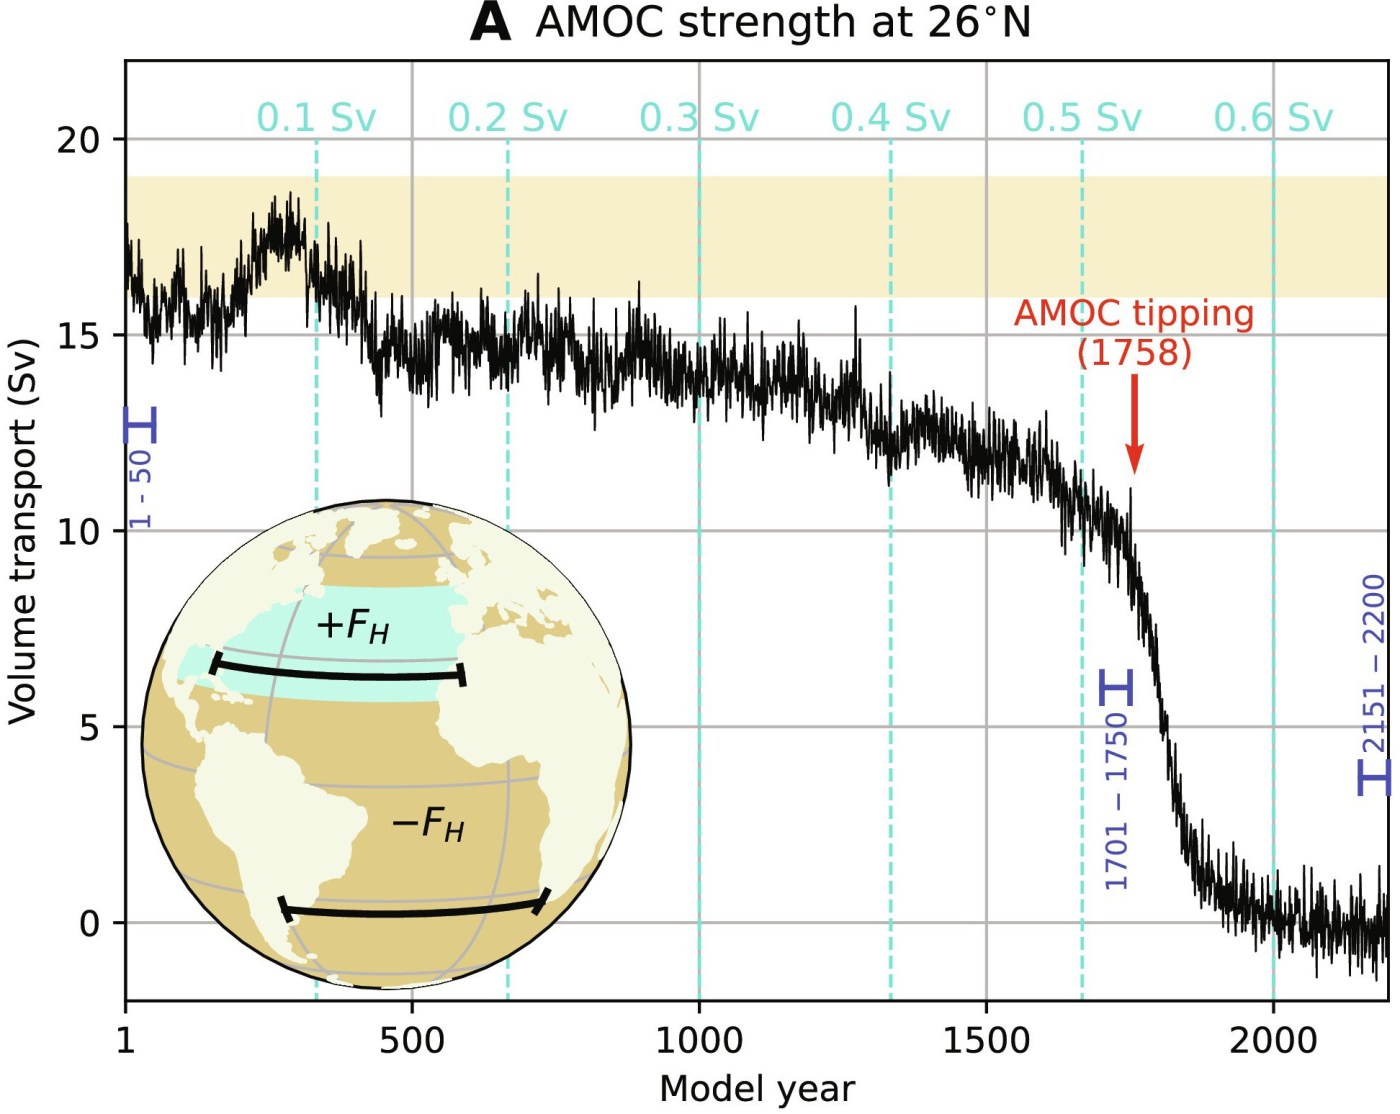
Figure 1 from van Westen et al. (2024). The AMOC strength at 1000 m and 26°N, where the yellow shading indicates observed ranges. The cyan-colored lines indicate the magnitude of freshwater forcing. The red arrow indicates the AMOC tipping point (model year 1758). Inset: The hosing experiment where fresh water is added to the ocean surface between 20°N and 50°N in the Atlantic Ocean (+FH) and is compensated over the remaining ocean surface (−FH). The black sections indicate the 26°N and 34°S latitudes over which the AMOC strength and freshwater transport are determined, respectively.
van Westen, R. M., Kliphuis, M. & Dijkstra, H. A. Physics-based early warning signal shows that AMOC is on tipping course. Sci. Adv. 10, eadk1189. https://doi.org/10.1126/sciadv.adk1189 (2024).
Stommel, H. Thermohaline Convection with Two Stable Regimes of Flow. Tellus, 13: 224-230. https://doi.org/10.1111/j.2153-3490.1961.tb00079.x (1961)

CNN: Critical Atlantic Ocean current system is showing early signs of collapse, prompting warning from scientists: https://www.cnn.com/2024/02/09/climate/atlantic-circulation-collapse-weather-climate
Washington Post: Why this is one of the planetary shifts scientists are most worried about: https://www.washingtonpost.com/climate-environment/2024/02/09/atlantic-ocean-amoc-climate-change/
According to carbonbrief.org, this paper received the most attention by news and social media among all climate related publications in 2024:
https://www.carbonbrief.org/analysis-the-climate-papers-most-featured-in-the-media-in-2024/