
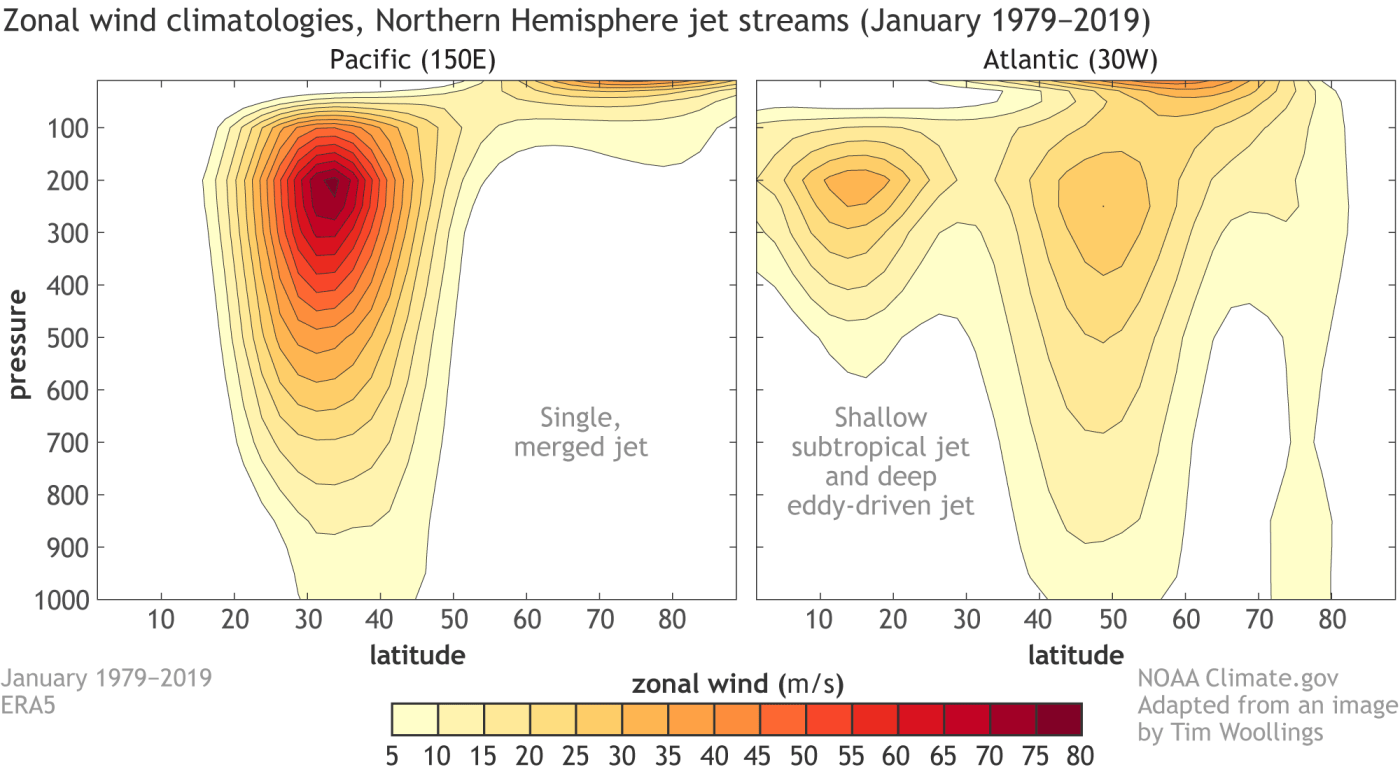
Two important atmospheric jet streams that shape the extratropical zonal wind field in both hemispheres are the subtropical jet and the subpolar jet. The subtropical jet is located around 30° latitude line at the boundary between the Hadley cell and the Ferrel cell, and is predominantly a high-altitude feature. Since it is largely in thermal-wind balance (i.e., the meridional thermal gradient is proportional to the vertical wind shear), it is usually referred to as a thermally driven jet. On the other hand, the subpolar jet is located around 50°-60° latitude lines between the Ferrel cell and the Polar cell, and is much deeper than the subtropical jet, and thus often extends to the land and sea surfaces. Since it is largely driven by momentum flux convergence by transient atmospheric eddies, it is often called an eddy-driven jet. Although the two jet streams are driven by different atmospheric processes, centered at different latitude bands, and have different vertical structures, it is quite hard to distinguish one from the other when they are zonally averaged around the globe. An ENSO blog article from climate.gov provides a very clear and simple answer to this question. It turns out that while the two jet streams are clearly identified and separated over the Atlantic Ocean, they are collocated around 30° latitude line over the Pacific Ocean. Since the two jet streams are merged over the Pacific, the zonal wind is stronger over the Pacific than the Atlantic. Additionally, the Pacific is much wider than the Atlantic. Thus, the zonal-mean wind profiles are largely determined by the zonal wind field over the Pacific Ocean.
Figure from Woolings (2022). The jet streams or average zonal wind (in meters per second) over a cross-section of the Pacific Ocean (left panel) and Atlantic Ocean (right panel). The x-axis shows the latitude in the Northern Hemisphere with the equator on the left and the North Pole on the right. The y-axis is the pressure level oriented with the surface on the bottom and the top indicating the top of the atmosphere. Data is based on ERA5 using a 1979-2019 climatology.
Woollings, T. (2022). What is the jet stream? ENSO Blog. Retrieved from https://www.climate.gov/news-features/blogs/enso/what-jet-stream

Leave a comment