
This new study accepted in Monthly Weather Review (Lee et al., 2021) presents an experimental model for Seasonal Probabilistic Outlook for Tornadoes (SPOTter) in the contiguous U.S. for March, April and May, and evaluates its forecast skill. This forecast model uses the leading empirical orthogonal function modes of regional variability in tornadic environmental parameters (i.e., low-level vertical wind shear and convective available potential energy), derived from the NCEP Coupled Forecast System version 2, as the primary predictors. A multiple linear regression is applied to the predicted modes of tornadic environmental parameters to estimate U.S. tornado activity, which is presented as the probability for above-, near-, and below-normal categories. The initial forecast is carried out in late February for March-April U.S. tornado activity, and then updated in late March for April-May activity. A series of re-forecast skill tests, including the jackknife cross-validation test, shows that the probabilistic re-forecast is overall skillful for predicting the above- and below-normal area-averaged activity in the contiguous U.S. for the target months of both March-April and April-May. The forecast model also successfully re-forecasts the 2011 super tornado outbreak season as well as the other three most active U.S. tornado seasons in 1982, 1991 and 2008, and thus may be suitable for an operational use for predicting future active and inactive U.S. tornado seasons.
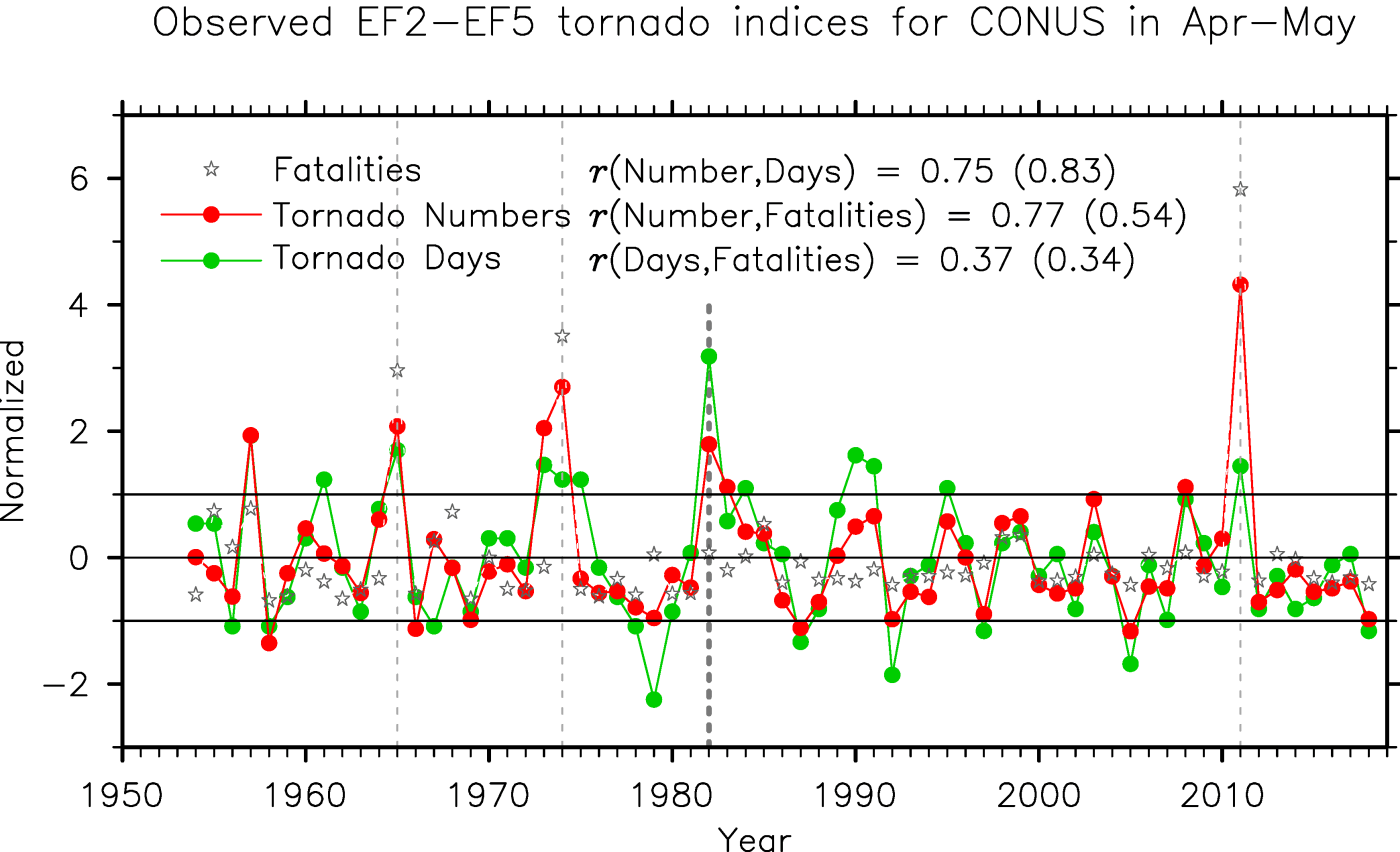
Figure 1 from Lee et al. (2021): Tornado numbers and tornado days for the contiguous U.S. during 1954 – 2018, based on EF2 – EF5 tornadoes in April-May, as diagnosed from Severe Weather database. The corresponding numbers of tornado-related fatalities for the same period are also shown. The tornado days are computed by counting the number of days in April-May of each year with at least one EF2 – EF5 tornado. The tornado numbers are the number of EF2 – EF5 tornadoes in April-May of each year. Each of these time series are normalized (i.e., the mean removed, and then divided by its standard deviation) separately for the re-forecast period (1982-2018) and the earlier period (1954-1981). Also shown are the correlations between the two tornado indices, between the tornado numbers and the number of tornado-related fatalities, and between the tornado days and the number of tornado-related fatalities. The values in parentheses are rank correlations based on Spearman’s rho method. The thin vertical gray dashed lines indicate the three deadliest historical U.S. tornado seasons in 1965 (287 fatalities in MAM), 1974 (328 fatalities in MAM) and 2011 (542 fatalities in MAM). The thick vertical gray dashed line indicates the starting year (i.e., 1982) of the re-forecast analysis.
Lee, S.-K., Lopez, H., Kim, D., Wittenberg, A. T. & Kumar, A. (2021). A Seasonal Probabilistic Outlook for Tornadoes (SPOTter) in the Contiguous U.S. based on the Leading Patterns of Large-Scale Atmospheric Anomalies. Monthly Weather Review, https://doi.org/10.1175/MWR-D-20-0223.1.

Leave a comment