
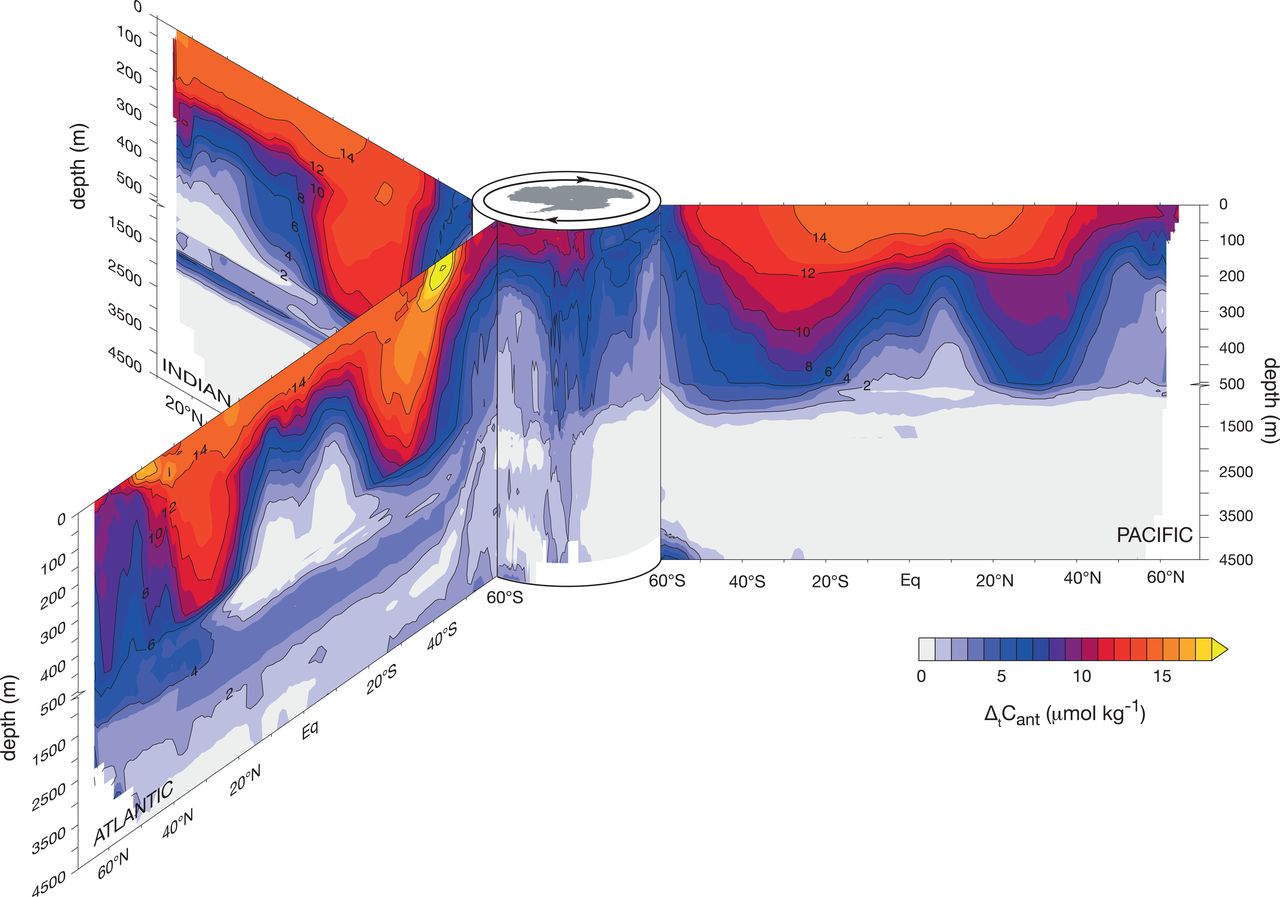
A paper published in Science estimated the oceanic sink of the anthropogenic CO2 (Cant) over the period of 1994 to 2007 by comparing observations collected from global repeated hydrography cruises between 2003 and 2007 to those from the World Ocean Circulation Experiment (WOCE) and Joint Global Ocean Flux Study (JGOFS) program during the 1980s and early 1990s. The study reported a global increase in Cant inventory of 34 ± 4 petagrams of carbon (Pg C) between 1994 and 2007, which represents 31 ± 4% of the global Cant emissions over this period. By reconstructing the map of increase in the oceanic storage of Cant in reference to the expected change given the increasing Cant, the study found substantial regional differences in storage rate due to ocean circulations. Between the basins, the storage in the Pacific (39 ± 4%) and Atlantic (35 ± 4%) has increased by roughly equal amounts, whereas the contribution of the Indian Ocean is smaller (21 ± 10%). In the Atlantic, newly formed North Atlantic Deep Water (NADW) carries the Cant deep into the North Atlantic Ocean then to the South Atlantic below 1500 m. In the Pacific, since there is no deep water formation, Cant is largely trapped in shallow mode and intermediate waters. The Southern Ocean south of 60°S is characterized as a region of low storage rate (about half of the global average) because the upwelling of NADW with low concentrations of Cant prevents a substantial accumulation of Cant there. Additionally, the non-divergent ocean currents (e.g., Ekman transport) in the region carry a massive amount of surface Cant (from the atmosphere) northward into the band of high storage between 50°S and 30°S. Interestingly, the study did not find any evidence of significant Cant sink associated with the Antarctic Bottom Water (AABW) Formation around the Antarctica. This is possibly due to the physical blocking of the air-sea exchange of Cant by Antarctic sea ice and the relatively short residence time of these waters at the surface.
Figure 1 from Gruber et al. (2019): Vertical sections of the change in anthropogenic CO2, ∆tCant, between the JGOFS–WOCE era (~1994) and the Repeat Hydrography–GO-SHIP era (~2007). Shown are the zonal mean sections in each ocean basin organized around the Southern Ocean in the center. The upper 500 m are expanded. Contour intervals are 2 μmol kg−1.
Gruber, N., D. Clement, B. R. Carter et al. (2019) The oceanic sink for anthropogenic CO2 from 1994 to 2007. Science 363 (6432), 1193 – 1199, https://doi.org/10.1126/science.aau5153, http://science.sciencemag.org/content/363/6432/1193

Leave a comment