
This blog post and the “Deep Dive” podcast, created by NotebookLM, are based on “Meridionally consistent decline in the observed western boundary contribution to the Atlantic Meridional Overturning Circulation” by Xing et al. (2026).
Xing et al. (2026) analyzes long-term observational data from four major mooring arrays to evaluate the Atlantic Meridional Overturning Circulation (AMOC). By examining ocean bottom pressure and geostrophic transport at the North Atlantic’s western boundary, the authors identify a consistent decline in deep overturning transports over the last two decades. While climate models have long predicted such a weakening due to greenhouse gas forcing, this study provides critical in situ evidence across multiple latitudes from 16.5°N to 42.5°N. The findings reveal that although the eastern boundary shows some strengthening, the western boundary contribution serves as a primary indicator of an overall AMOC slowdown. The researchers conclude that using a standardized methodological approach at the western boundary offers a reliable way to monitor these vital circulation changes. Ultimately, the study suggests that the observed downward trend is statistically significant and reflects a large-scale shift in the North Atlantic’s climate-regulating currents.
For decades, the Atlantic Meridional Overturning Circulation (AMOC) has been the boogeyman of climate modeling—a “great conveyor belt” of heat and salt that, if collapsed, would rewrite the global climate map. We knew it should be slowing under the weight of greenhouse gas forcing, but proving it in the real world was like trying to measure the pulse of a giant through a layer of static. Short-term data and conflicting methodologies left us guessing: was the AMOC truly in decline, or were we just seeing the ocean’s natural decadal breath?
The mystery has finally found its breakthrough. In a landmark study published in Science Advances (Xing et al., 2026), researchers have moved past surface-level noise by effectively “weighing” the ocean. By deploying a sophisticated “stepping method” to analyze Ocean Bottom Pressure (OBP) gradients, they have unmasked a multi-decadal decline that has been hidden in plain sight.
Takeaway 1: The “Canary in the Coal Mine” is Screaming
The core of the discovery lies at the Atlantic’s western boundary. While previous efforts tried to monitor the entire width of the basin, Xing et al. (2026) recognized that the western edge is the “boundary of action.” It is here that signals from the high latitudes—where cold, dense water sinks—manifest first and most violently.
By focusing on the OBP gradients—essentially measuring the weight of the water column to see through the chaos of surface waves—the study identified the western boundary as our most sensitive early warning system.
“In a sense, observations at the western boundary, in isolation from the eastern boundary, constitute the canary in a coal mine for the tendency of the AMOC.”
Takeaway 2: A Continent-Sized Trend: Consistency Across the Map
This is no localized glitch. The weakening signal is “meridionally consistent,” echoing across four major observational arrays spanning 2,500 miles of coastline. From the tropics to the mid-latitudes, the trend is unidirectional: the deep western overturning is losing its strength.
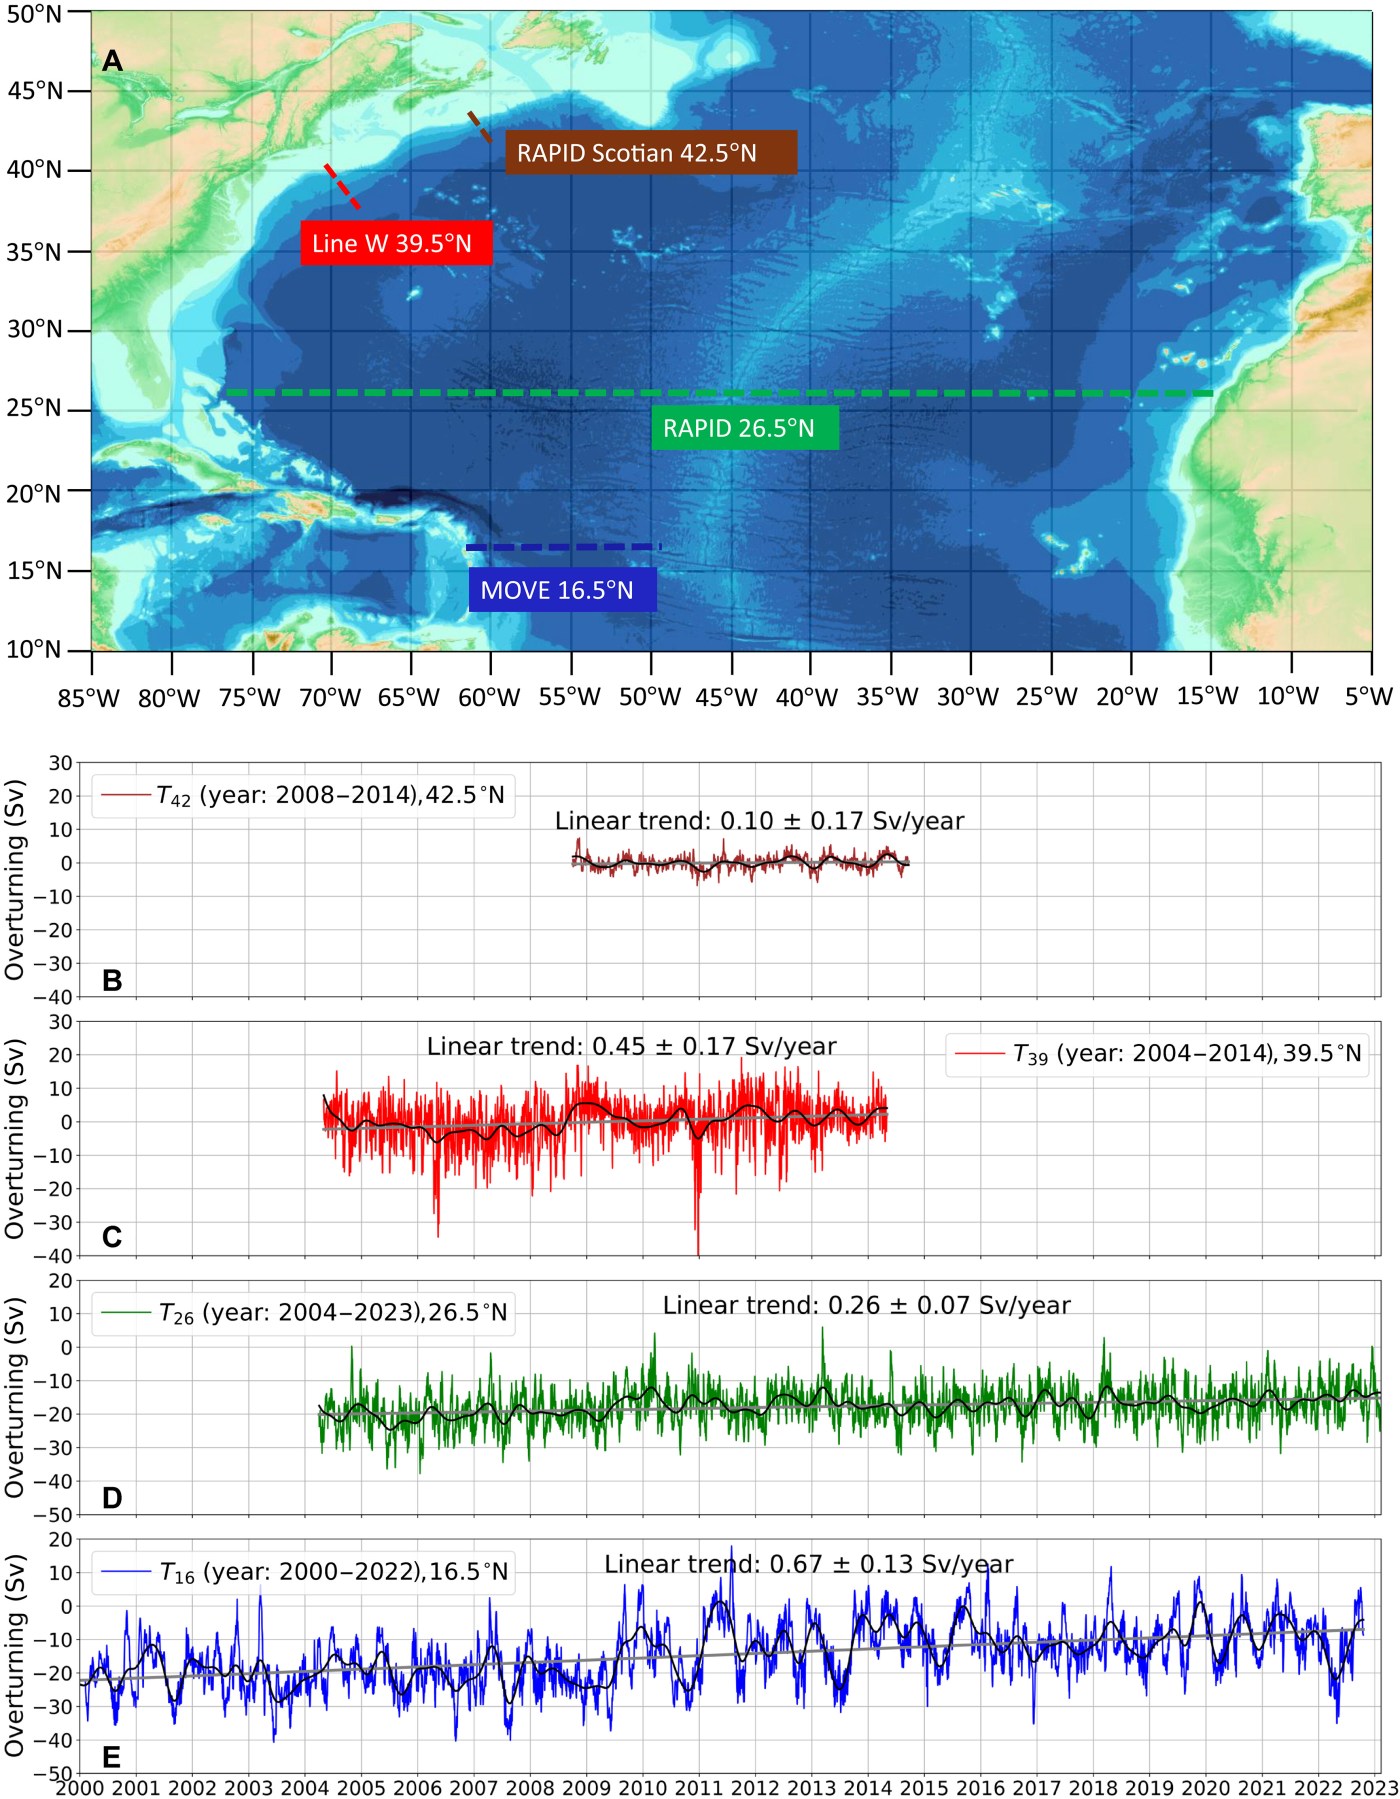
While the direction of the trend is consistent across all four monitoring sites, the statistical precision is strongest in the subtropical belt. At the RAPID-Scotian line (42.5^\circ\text{N}), the trend is consistent but not yet statistically significant within two standard deviations, while the other three sites show a robust, undeniable decline.
| Latitude | Array Name | Observed Decline Rate (Sv/year) |
|---|---|---|
| 16.5∘N | MOVE | 0.67±0.13 |
| 26.5∘N | RAPID-MOCHA | 0.26±0.07 |
| 39.5∘N | Line W | 0.45±0.17 |
| 42.5∘N | RAPID-Scotian | 0.10±0.17 |
Note: A Sverdrup (Sv) is the unit of the gods in oceanography. One Sverdrup represents a flow of one million cubic meters per second—roughly the combined flow of every river on Earth.
Takeaway 3: The Hidden Weakness: Why the Full Picture is Deceptive
If the western boundary is faltering so significantly, why didn’t our total AMOC measurements scream it sooner? The answer lies in a counter-intuitive “partial compensatory effect.” While the western boundary is weakening, the eastern boundary has actually been strengthening (a trend of -0.16 ± 0.06 Sv/year at 26.5∘N).
This eastern pushback acts as a temporary mask, softening the blow to the total AMOC reading and creating a deceptive sense of stability. It is a reflection of the ocean’s staggering complexity: one side of the basin is attempting to balance the other, even as the western engine—the primary driver—is beginning to fail.
Takeaway 4: The Detective Story of the “Missing” Signal
The reason this signal remained “missing” for so long comes down to a fundamental shift in scientific assumptions regarding the “reference level”—the depth where oceanographers assume the water stops moving.
For years, the MOVE array (16.5^\circ\text{N}) used a deep reference level of 4950 meters, assuming the ocean was still at the very bottom. Under this assumption, the data showed no significant trend. However, by shifting the reference level to 1000 meters—the actual average depth where the overturning streamfunction is at its maximum—the weakening signal suddenly “popped.” This detective work revealed that by using the wrong zero-point, we were literally looking right through the decline.
Takeaway 5: Observations are Outpacing the Models
Our digital ghosts are failing to keep pace with the thundering reality of the Atlantic. When we compare these direct observations to the CMIP6 climate models, the results are sobering.
The CMIP6 simulations predicted an AMOC decline of roughly 0.076 Sv/year. But at the MOVE array, we observed a decline of 0.67 Sv/year—nearly nine times faster than the simulations. This suggests that the “tipping points” we once thought were decades away may be rushing toward us.
This isn’t just a change in speed; it’s a change in structure. The circulation is “shoaling,” or moving higher in the water column, at a rate of 1.7 meters per year. The system is physically compressing as it weakens, a visceral sign of a circulatory system under extreme stress.
The Forward-Looking Summary: A System in Flux
We now have the smoking gun: direct, in situ evidence of a multi-decadal decline across the subtropical North Atlantic. The “great conveyor belt” is slowing, and for the first time, we have a consistent, basin-wide methodology to prove it.
While the strengthening of the eastern boundary has provided a temporary shield, we must ask: is this a permanent stabilizer, or merely a final, struggling delay before the western collapse pulls the entire system down? As reality continues to outrun our predictions, the need for continuous, basin-wide monitoring is no longer just a scientific goal—it is a planetary necessity.
Figure 1 from Xing et al. (2026): Deep western overturning transports in the North Atlantic. (A) General Bathymetric Chart of the Oceans (GEBCO) bathymetry of the North Atlantic basin between 10°N to 50°N. The colored dashed lines depict the locations of the four observation arrays used in this study (RAPID-Scotian line, Line W, RAPID-MOCHA, and MOVE array). Time series of deep western overturning transport at RAPID-Scotian line (B), Line W (C), RAPID-MOCHA (D), and MOVE array (E). Note here that T16 and T26 are absolute transports, while T39 and T42 are transport anomalies. In each panel, the colored line is the daily time series, and the black solid line is a 3-month third-order Butterworth low-pass filtered version. The estimated uncertainties on the daily time series are 1.4, 1.5, 4.6, and 1.2 Sv, respectively from T16 to T42. The gray lines indicate the linear trend estimated for each daily time series by modeling mixed fixed and random effects. Trend uncertainties correspond to 2-σ confidence intervals.
Xing, Q. et al. (2026). Meridionally consistent decline in the observed western boundary contribution to the Atlantic Meridional Overturning Circulation. Sci. Adv. 12,eadz7738. https://doi.org/10.1126/sciadv.adz7738

Leave a comment