
This blog post and the “Deep Dive” podcast, created by NotebookLM, are based on “Multi-decadal weakening of the Atlantic Overturning from a physics and observation-based reconstruction” by Li et al. (2026).
A preprint article by Li et al. (2026) details a new scientific reconstruction of the Atlantic meridional overturning circulation (AMOC) since 1940, utilizing a physics-based water-mass transformation framework. By combining ocean temperature and salinity observations with atmospheric reanalysis, the researchers have established a more comprehensive history of ocean currents than was previously possible through direct measurements. The study identifies a sustained multi-decadal weakening of the AMOC across the entire Atlantic basin, showing significant declines since 1960. Findings suggest that while air-sea fluxes dominate the circulation’s mean strength, the long-term slowdown is primarily driven by subsurface mixing reductions and changes in water volume. This reconstruction offers a practical framework for tracking modern climate shifts and highlights how changes in the South Atlantic may act as a predictor for future North Atlantic declines.
1. The Hook: A Quiet Crisis in the Deep
Beneath the rolling surface of the Atlantic lies a silent, planetary engine. Known as the Atlantic Meridional Overturning Circulation (AMOC), this system of currents acts as the Earth’s primary thermal regulator, ferrying tropical warmth to Europe and pulling carbon into the abyss. For decades, the AMOC’s health has been the subject of a high-stakes scientific detective story: Is the “great conveyor belt” truly slowing down, or are we merely seeing the ocean’s natural, decadal pulse?
The debate has often been muddled by short-term data and indirect “fingerprints.” However, a new physics-based reconstruction is providing a staggering clarity to the picture. By moving beyond surface-level symptoms and measuring the internal “ledger” of the ocean’s volume, researchers have revealed that the AMOC is not merely fluctuating; it is in a state of multi-decadal decline. This isn’t just a North Atlantic story. We are now learning that the South Atlantic acts as an oceanic nervous system, providing a “geophysical crystal ball” that allows us to look 20 years into our climatic future.
2. Takeaway 1: The Decline is Steeper Than We Thought
The new data, synthesized from multiple observation-based datasets, confirms that the AMOC’s weakening is a persistent, modern reality rather than a temporary lull. Since 1960, the circulation has exhibited a sharp linear decline across the entire basin. The numbers are a wake-up call for the century ahead:
- 13.7 Sv decline per century at 34.5°S (the gateway of the South Atlantic).
- 8.3 Sv decline per century at 26°N (the low-latitude North Atlantic).
- 7.3 Sv decline per century in the subpolar cell.
These aren’t marginal shifts. This represents a 16% to 23% weakening since the mid-20th century. Most alarming, however, is the acceleration. While the decline was steady for decades, the rate of collapse has shifted into a higher gear in the new millennium.
“The AMOC strength within 10°N–40°N experienced a near monotonous decline from 1950 through to the early 2000s, followed by a rate of decline that has more than doubled since 2004.”
3. Takeaway 2: The South Atlantic is a 20-Year “Time Machine”
Perhaps the most transformative finding is the discovery of the ocean’s interhemispheric connectivity. We have long viewed the South Atlantic as a passive conduit, but it is actually the early warning system for the global climate. Changes in the South Atlantic propagate northward like a slow-moving wave, creating a predictable delay.
The Lag-Time Timeline:
- 20 Years: The time it takes for a trend observed at 34.5°S to reach the mid-latitudes of the North Atlantic (40°N).
- 25 Years: The time it takes for that same signal to reach the subpolar regions (60°N).
This means that the North Atlantic of 2045 is being written in the South Atlantic today. This “lead time” is a critical tool for policy and adaptation, but it also carries a somber implication: the next two decades of weakening in the North are likely already “baked in” by the trends we are currently witnessing in the southern limb.
4. Takeaway 3: It’s What’s Under the Surface That Counts
A counter-intuitive revelation of this study is that the primary driver of this long-term collapse is not surface warming. While the sun-warmed surface of the ocean makes for dramatic headlines, the “villain” of the story is salinity stratification—a hidden change in the ocean’s density.
Think of it like oil and water: as the subpolar North Atlantic becomes fresher and more stratified, it creates a “cap” that prevents vertical mixing. Without this mixing, the “sink” at the end of the conveyor belt stalls.
| Component | Time-Mean Strength | Long-term Weakening Trend | Significance |
| Air-Sea Fluxes | Accounts for ~80% of mean strength | Primarily exhibits decadal variability | Surface exchanges define the average state but mask the decline. |
| Subsurface Mixing & Volume | Secondary to mean strength | The primary driver of long-term weakening | The “hidden” threat; vertical mixing efficiency is plummeting. |
Crucially, the researchers addressed a common point of skepticism: they excluded freshwater from river runoff and sea-ice melt from certain calculations, finding that even without these factors, the physics-based decline remains robust. The stratification is an internal mechanical failure of the engine itself.
5. Takeaway 4: Bridging the “Data Gap” with Physics
For years, we have guessed the AMOC’s health based on “fingerprints”—symptoms like the “warming hole” (a cold patch in the North Atlantic) or salinity build-ups in the South. But fingerprints are messy; they can be influenced by local weather and atmospheric noise.
The breakthrough here is the Water-Mass Transformation (WMT) framework. This approach allows scientists to stop guessing based on symptoms and start measuring the “organ” directly. By treating the ocean as a volumetric ledger—accounting for air-sea buoyancy, mesoscale mixing, and small-scale turbulence—the WMT framework bridges the gap between the short-term snapshots provided by modern mooring arrays (like RAPID and OSNAP) and the broader historical record.
“This approach provides a practical physics-based approach for assessing the historical evolution of the AMOC.”
6. The “So What?”: Why This Weakening Matters
If the AMOC’s heartbeat continues to fade, the consequences will ripple across the globe, disrupting lives and ecosystems far from the Atlantic’s shores:
- A Shivering Europe: A significant reduction in northward heat transport would bring harsher, more frequent extreme winters to Northwest Europe and the UK.
- Disrupted Tropical Rainfall: Shifting heat balances could move tropical rain belts, threatening the water security and agriculture of millions.
- A Choked Carbon Sink: As the circulation slows, the ocean’s ability to absorb and bury atmospheric CO2 diminishes, creating a dangerous feedback loop for global warming.
- Atmospheric Chaos: The slowdown is increasingly linked to disturbances in the jet stream, potentially fueling more erratic and violent storm tracks in the Northern Hemisphere.
7. Conclusion: A Question for the Decades Ahead
The data is no longer ambiguous: the AMOC’s decline is a multi-decadal reality, not a temporary phase. We have observed a 16% to 23% reduction in strength, and the rate of that decline is accelerating.
Because the South Atlantic provides a 20-year window into the North’s future, the current sustained weakening at 34.5°S acts as a clear, urgent precursor. We are flying through a changing climate with the benefit of a 20-year head start on the data, yet our ability to act depends on our commitment to the very systems—RAPID, SAMBA, and OSNAP—that gave us this warning.
As we look to the horizon, a critical question remains: Will we use this 20-year lead time to adapt, or will we simply watch as the North Atlantic’s future mirrors the South’s present?
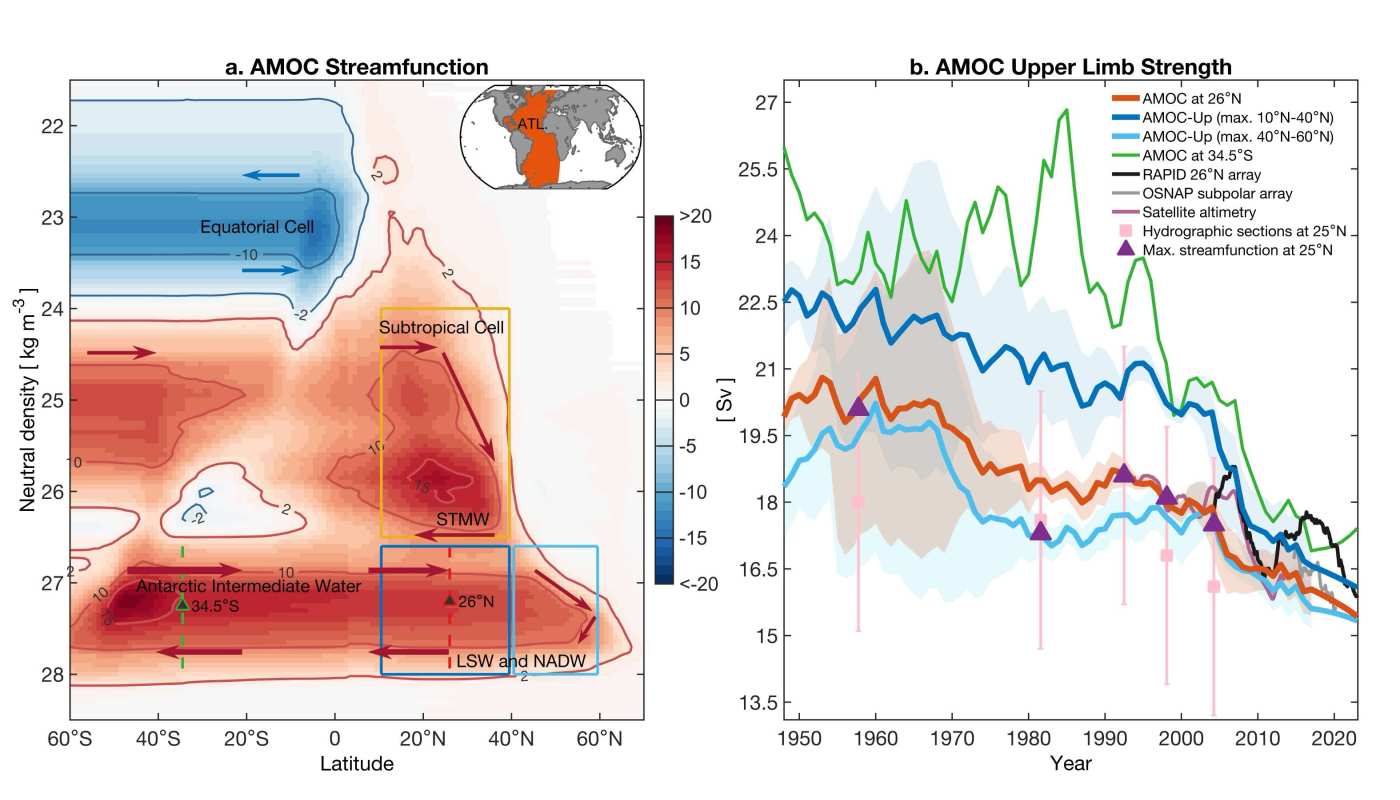
Figure 3 from Li et al. (2026): Structure and time evolution of the Atlantic meridional overturning circulation (AMOC). a, Ensemble-mean AMOC streamfunction (Sv = Sverdrup = 106 m3 s-1) for the period 2004–2023, reconstructed using the WMT framework from the IAPv4.2, EN4-ESM, Ishii, and SIO RG-Argo datasets (Methods). Superimposed contours show streamfunction values of –10, –2, 2, 10, and 15 Sv. The inset in the top right shows the Atlantic basin mask used in this study (orange-red shading). b, Ensemble-averaged AMOC strength (Sv) shown as annual means (thick lines with shadings indicating one standard deviation across datasets), derived from IAPv4.2, EN4-ESM, Ishii, and SIO RG-Argo. Red line shows the AMOC strength at 26°N; green line shows the AMOC strength at 34.5°S; dark blue line shows the AMOC upper-limb strength within 10°N–40°N; light blue line shows the subpolar AMOC strength within 40°N–60°N. All reconstructed lines represent 15-year running averages, with the last 7 years smoothed using a locally weighted linear regression (‘lowess’) approach. Also shown are the AMOC strength observed by the RAPID array at 26ºN (black line; 5-year running mean) and the OSNAP array in the subpolar North Atlantic (grey line; 5-year running mean). Pink squares represent ship-based hydrographic estimates of the integrated transport over the upper 1100 m at 25°N, with pink bars indicating the 2.9 Sv standard deviation from RAPID observations over 2004–2009, as reported in Table 5 of ref.20. Purple triangles indicate hydrographic estimates of the maximum streamfunction at 25°N22. The purple line shows the AMOC estimate derived from satellite altimetry for 1993–2014.
Li, Z., England, M., Groeskamp, S. et al. Multi-decadal weakening of the Atlantic Overturning from a physics and observation-based reconstruction, 09 March 2026, PREPRINT (Version 1) available at Research Square. https://doi.org/10.21203/rs.3.rs-7916884/v1

Leave a comment