
This blog post and the “Deep Dive” podcast, created by NotebookLM, are based on “Km-scale coupled simulation and model–observation SST trend discrepancy” by Kang et al. (2026).
This research article investigates why traditional climate models fail to replicate the observed cooling in the Southern Ocean and southeastern tropical Pacific. By utilizing the ICON coupled model at a kilometer-scale resolution, the authors successfully reproduced these historical sea surface temperature trends which standard models typically miss. The study identifies that resolving mesoscale ocean eddies is vital for accurately simulating how heat is transported and taken up in the Southern Ocean. Additionally, the high-resolution simulation captures stronger stratocumulus cloud feedbacks, which serve as a critical link in communicating high-latitude cooling to the tropics. These findings suggest that finer spatial resolution is necessary to fix persistent model biases and provide more dependable near-term climate projections. Ultimately, the research highlights the importance of dynamic ocean adjustments and local atmospheric interactions in shaping global warming patterns.
The Resolution Revolution: Why Our Best Climate Models Were Wrong About the Pacific—And How We’re Fixing Them
1. Introduction: The Cold Spot in a Warming World
The map of global warming is traditionally imagined as a sea of deepening reds, a uniform march toward a hothouse future. Yet, for decades, satellite data has whispered a different story, revealing a “warming paradox.” While global mean temperatures climb, two stubborn bastions of blue—the Southern Ocean and the southeastern tropical Pacific—have remained persistently cool.
This isn’t just a minor rounding error; it is a fundamental blind spot in our digital twins of the Earth. Current climate models, specifically those in the Coupled Model Intercomparison Project (CMIP) ensemble, consistently predict warming in these regions, creating a systemic discrepancy that erodes our confidence in regional forecasts. The problem isn’t the data; it’s the definition. By moving to the “km-scale” ICON model, we are finally seeing the climate in high definition, resolving the physical puzzles that coarser simulations simply couldn’t “see.”
2. The 5-Kilometer Breakthrough: Seeing the “Ocean Weather”
The technical leap behind this breakthrough is a dramatic sharpening of the model’s focus. The ICON model utilizes a 5-km grid for the ocean and 10 km for the atmosphere. This is not just an incremental improvement; it represents a crossing of a critical physical threshold. Research indicates that 10 km is the absolute minimum resolution required to resolve mesoscale eddies—the “ocean weather” that dictates heat transport.
This resolution allows for the explicit representation of deep atmospheric convection and those vital eddies, moving beyond the era of “parameterization”—the scientific term for the educated guesses models use to fill in the gaps. By simulating these processes directly, ICON aligns with reality in a way previous efforts, such as the 25-km HighResMIP models, never could.
“Using a km-scale coupled simulation, we successfully reproduce these key features by explicitly resolving ocean eddies and simulating realistically strong stratocumulus cloud feedbacks.”
3. Mesoscale Eddies: The Missing Heat-Movers
In the Southern Ocean, the climate is dictated by a collision of forces. Traditionally, we understood that strengthened westerly winds drive polar waters northward, a cooling effect. However, in coarse models, this is often cancelled out by a failure to account for mesoscale eddies. In the high-resolution world of ICON, these eddies act as a “dynamical thermostat.”
The cooling observed in the Pacific sector of the Southern Ocean is driven by a local, 3-hPa deepening of the Amundsen Sea Low, which strengthens the winds. The resulting dynamical adjustment is visible in a northward displacement of the Antarctic Circumpolar Current (ACC). This shift expands the outcropping of cold polar water masses, effectively exporting heat away from the Antarctic fronts and into other basins. Traditional models, unable to resolve these 10-km features, systematically misrepresent Southern Ocean overturning and heat uptake, leading to a “warm bias” that distorts the entire global picture.
4. The Cloud Connection: A High-Resolution Messenger
The Southern Ocean’s chill does not stay at the pole; it is transmitted to the equator via a sophisticated atmospheric teleconnection. This signal travels northward through the “wind–evaporation–SST feedback,” where intensified southeasterly winds enhance surface evaporation, cooling the tropical waters. Once the signal reaches the equatorial Pacific, it extends westward through the Bjerknes feedback, a process where the cooling of the sea surface and the strengthening of trade winds reinforce one another.
This cooling is amplified by the vast stratocumulus cloud decks off the coasts of Chile and Peru. Here, the Andes Mountains play a critical role as an “inversion stabilizer.” By acting as a physical barrier to warm air advection from the South American interior, the mountains preserve the low-level temperature inversion—the “lid” that keeps these thick cloud decks intact.
Objectivity requires noting that while ICON is a massive leap forward, it is not perfect; its cloud-SST coupling is approximately 33% weaker than observed. However, it remains significantly more realistic than CMIP models, which are often too weak to sustain this teleconnection.
“The sufficiently strong cloud feedback enables the equatorward propagation of the Southern Ocean cooling signal in ICON, ultimately contributing to the simulated southeastern Pacific cooling.”
5. Correcting the Record on Global Warming Trends
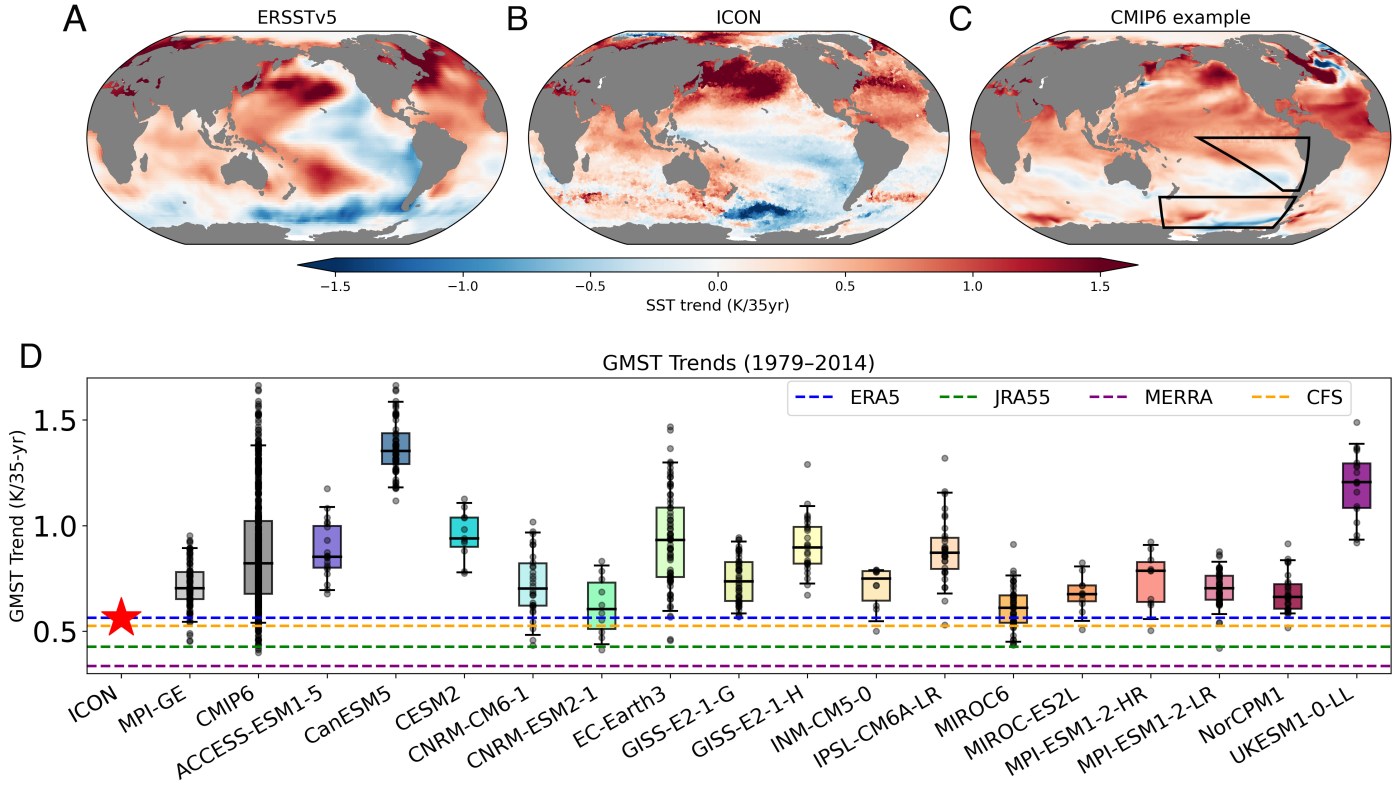
By missing these regional cooling zones, conventional models have been overestimating the pace of historical warming. The ICON simulation reveals a Global Mean Surface Temperature (GMST) increase of 0.56 K over the 1979–2014 period—a figure that matches ERA5 observational data with startling precision.
When the record is extended to 2024, the ICON model’s performance becomes even more impressive. It correctly differentiates between the internal variability of the North Pacific and the forced, persistent cooling of the Southern Hemisphere. This distinction is vital: the Southern Ocean accounts for roughly 70% of anthropogenic heat uptake. If a model cannot simulate how this region absorbs and exports heat, it is essentially guessing at the global total.
6. A Delayed Transition to an El Niño Future
The implications of the “Resolution Revolution” extend far beyond historical record-keeping; they rewrite our expectations for the coming decades. Most current models project a rapid transition from the current La Niña-like state—marked by a cool eastern Pacific—toward a future dominated by El Niño-like warming.
However, ICON’s high-definition view suggests we may have more time. Because km-scale models resolve the processes that delay Southern Ocean warming, they indicate that the transition to an El Niño-dominated tropical Pacific may happen much later than previously projected. The Southern Ocean cooling signal acts as a powerful brake on tropical warming, suggesting a stay of execution for the current Pacific climate state.
7. Conclusion: The New Frontier of Climate Confidence
The success of the ICON simulation proves that the fine-scale processes we once dismissed as “details”—the swirling of a 10-km eddy or the stabilizing shadow of the Andes—are actually the gears that drive the global climate engine. We have moved past the era of blurry climate projections; we are now seeing the Earth’s systems in “high definition.”
As we refine these km-scale models, we must ask: If our models have been overestimating warming by missing these cooling zones, how will our adaptation strategies change as we finally begin to see the climate in high definition? The Resolution Revolution doesn’t just change the data—it changes the horizon of what we can prepare for.
Figure 1 from Kang et al. (2026): Comparison of surface temperature trends over 1979 to 2014 in observations, ICON, and CMIP6 ensemble. Spatial maps of SST trend based on (A) ERSSTv5 observations (33), (B) ICON historical simulation, (C) one of the CMIP6 realizations close to CMIP6 multi-model mean. (D) Box-whisker plot of global mean surface temperature (GMST) trends for 100-member MPI-ESM Grand Ensemble (MPI-GE), all available CMIP6, and subgroups of CMIP6 ensembles that have 10 members or more of their particular model. Solid black line within each box mark 50% percentile, edges of the box represent 25% and 75% percentile, and whiskers mark 5% and 95% percentile. Gray circles represent individual ensemble members. The GMST trend from ICON (indicated by the red star and red solid line) can be compared with multiple observational products, as shown in the legend.
Kang, S. M., D.A. Putrasahan,N.G. Brizuela,H. Haak,J. Kröger,J. Marotzke,B. Stevens, & J. von Storch. (2026) Km-scale coupled simulation and model–observation SST trend discrepancy, Proc. Natl. Acad. Sci. U.S.A. 123 (8) e2522161123. https://doi.org/10.1073/pnas.2522161123

Leave a comment