
Adams, K. H., Reager, J. T., Buzzanga, B. A., David, C. H., Sawyer, A. H., & Hamlington, B. D. (2024). Climate-induced saltwater intrusion in 2100: Recharge-driven severity, sea level-driven prevalence. Geophysical Research Letters, 51, e2024GL110359. https://doi.org/10.1029/2024GL110359: The projected increase in regional saltwater intrusion to Aquafer (for drinking & etc) is driven not only (1) by sea level rise but also by (2) a reduction in groundwater replenishment (i.e., caused by drought). The latter is much more important in many regions.
Liu, F., Luo, Y., Song, F. et al. Weakening of subsurface ocean temperature seasonality over the past four decades. Commun Earth Environ 5, 802 (2024). https://doi.org/10.1038/s43247-024-01986-4: The seasonal cycle in ocean temperature has increased in the near-surface (mixed layer) and decreased in the subsurface (below mixed layer). This is due to preferential surface warming in the summer season and the increase in stratification.
Falco, P., Krauzig, N., Castagno, P. et al. Winter thermohaline evolution along and below the Ross Ice Shelf. Nat Commun 15, 10581 (2024). https://doi.org/10.1038/s41467-024-54751-8: Warm & salty Circumpolar Deep Water (CDW) drives basal melting of the ice shelf in western Antarctica. However, new Argo profile data found no CDW under the Ross Sea ice shelf in 2020-2023.
Terhaar, J., Vogt, L. & Foukal, N.P. Atlantic overturning inferred from air-sea heat fluxes indicates no decline since the 1960s. Nat Commun 16, 222 (2025). https://doi.org/10.1038/s41467-024-55297-5: Linking AMOC and surface heat flux shows no trend in the AMOC since the 1960s.
Boot, A. A., Steenbeek, J., Coll, M., von der Heydt, A. S., & Dijkstra, H. A. (2025). Global marine ecosystem response to a strong AMOC weakening under low and high future emission scenarios. Earth’s Future, 13, e2024EF004741. https://doi.org/10.1029/2024EF004741: A slowdown of the major Atlantic Ocean current system (due to water hosing) decreases cross-stream density gradient (through thermal wind relation). As such, the upwelling around the current system (to the right in SH such as Benguella upwelling, and to the left in NH such as the US east coast) has to decrease reducing surface nitrate concentration in that region.
Großelindemann, H., Castruccio, F. S., Danabasoglu, G., and Biastoch, A.: Long-term variability and trends in the Agulhas Leakage and its impacts on the global overturning, Ocean Sci., 21, 93–112, https://doi.org/10.5194/os-21-93-2025, 2025: According to a high-resolution coupled model, despite the projected weakening of the Agulhas Current (in the Indian Ocean) due to a decrease in ITF, the Agulhas leakage to the Atlantic will increase driven by the strengthening SH Westerlies. However, this does not significantly affect the projected slowdown of the AMOC at 26.5N.
Frey, D. I., Zuev, O. A., Mekhova, O. S., Fomin, V. V., Morozov, E. G., Krechik, V. A., et al. (2025). An 800-km-long erosional channel system as a pathway for Antarctic Bottom Water abyssal flow into the Northwest Atlantic. Journal of Geophysical Research: Oceans, 130, e2024JC021846. https://doi.org/10.1029/2024JC021846: Russian oceanographers detected an AABW pathway into the Northwestern Atlantic (east of the Caribbean Sea).
Wang, Q., Shu, Q., Wang, S. et al. Dominant inflation of the Arctic Ocean’s Beaufort Gyre in a warming climate. Commun Earth Environ 6, 40 (2025). https://doi.org/10.1038/s43247-025-02028-3: This paper discusses the inflation of the Beaufort Gyre and its freshwater holding capacity in a warming world with an important implication for the AMOC.
Beniche, M., Vialard, J., Lengaigne, M., & Hall, N. M. J. (2025). How well do AMIP6 and CMIP6 reproduce the specific extreme El Niño teleconnections to North America? Journal of Geophysical Research: Atmospheres, 130, e2024JD041740. https://doi.org/10.1029/2024JD041740: Extreme El Nino events promote a robust eastward shift in El Nino-teleconnection patterns over North America. This finding has an important implication for California wildfire, drought, and general winter hydroclimate in the southwest & southeast US (including Florida).
de Jong, M. F., Fogaren, K. E., Le Bras, I., McRaven, L., & Palevsky, H. I. (2025). Atmospheric forcing dominates the interannual variability of convection strength in the Irminger Sea. Journal of Geophysical Research: Oceans, 130, e2023JC020799. https://doi.org/10.1029/2023JC020799: A 17-year-long hydrographic observation (2002-2020) shows that the interannual variability in the atmospheric forcing largely determined the observed changes in convection in the central Irminger Sea. Changes in stratification (likely linked to melting ice) did not affect the convection significantly during the study period.
Guan, S., Liu, P., Zhang, Y., Lin, I.-I., Zhou, L., Yang, Q., et al. (2025). Enhanced sea surface cooling and suppressed storm intensification during slow-moving track-turning stage of tropical cyclones. Journal of Geophysical Research: Oceans, 130, e2024JC022234. https://doi.org/10.1029/2024JC022234: A TC track-turning is accompanied by a temporary stagnation of the moving storm. This leads to increased SST cooling and thus a downgrade in TC intensity. This means that “TCs with smaller turning angles are more likely to develop into intense TCs”.
Lee, C., Song, H., Choi, Y. et al. Observed multi-decadal increase in the surface ocean’s thermal inertia. Nat. Clim. Chang. (2025). https://doi.org/10.1038/s41558-025-02245-w: Ocean has been losing its SST damping capacity (see Figure) since 1982 due to increased stratification, allowing SST anomalies and the associated climate and extreme weather events to attain stronger amplitude and persist longer.
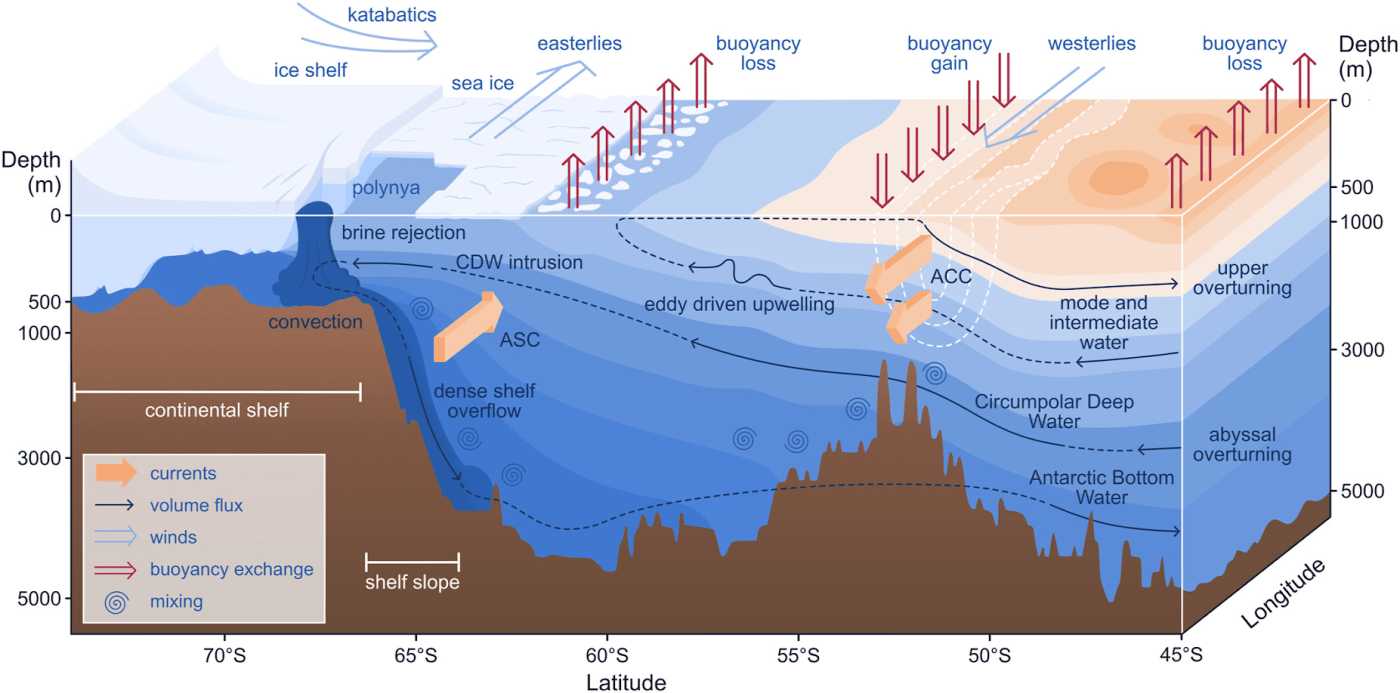
Bennetts, L. G., Shakespeare, C. J., Vreugdenhil, C. A., Foppert, A., Gayen, B., Meyer, A., et al. (2024). Closing the loops on Southern Ocean dynamics: From the circumpolar current to ice shelves and from bottom mixing to surface waves. Reviews of Geophysics, 62, e2022RG000781. https://doi.org/10.1029/2022RG000781: A nice review paper on the Southern Ocean current system with many useful schematic figures. This is a great read for our understanding.
Figure 2 from Bennetts et al. (2024). Schematic of the Southern Ocean’s large-scale circulation, where the ocean colors indicate the density, ranging from lighter (dark orange) to denser (dark blue) waters, and isopycnal contours are the interfaces between the layers. The horizontal gradients in density are correlated with largely geostrophic currents, including the Antarctic Circumpolar Current (ACC) and Antarctic Slope Current, above the shelf slope/break. Antarctic Bottom Water is generated by convection and brine rejection on the continental shelf, and flows down into the abyssal ocean. Warmer Circumpolar Deep Water is upwelled in the mid-depths and plays a key role in the melt rate of glacial ice shelves. These processes collectively form the Southern Ocean component of the upper and abyssal overturning cells, as indicated by the dashed lines. Farther to the north, at the density fronts of the ACC, are the formation sites of northward flowing mode and intermediate waters. The topography, isopycnals, and glacial ice shelf profile on the southern side of the schematic are from observations in the Ross Sea, although they are artificially extended to the north to represent a more typical condition for the ACC. Note that the depth scale is not linear.

Leave a comment