
This blog post and the “Deep Dive” podcast, created by NotebookLM, are based on “Multi-model estimate of Antarctic ice-shelf basal mass budget and ocean drivers” by Galton-Fenzi et al. (2026).
This research paper presents the Realistic Ice Shelf-Ocean Estimates (RISE) Project, which synthesizes nine different numerical simulations to establish a multi-model mean (MMM) of Antarctic ice-shelf melting. By aggregating diverse community models, the authors aim to reduce individual biases and provide more reliable projections for sea-level rise and ice-sheet stability. The study reveals that while models generally agree on thermal driving and ocean currents, they differ significantly in their representation of salinity and refreezing processes. Comparative analysis shows that the multi-model average predicts a net mass loss of 843 Gt yr−1, which is notably lower than current satellite-derived estimates. Ultimately, the research defines a thermo-kinematic melt sensitivity metric to better characterize the physical interactions at the ice-ocean interface. This collaborative framework serves as a vital benchmark for refining climate models and guiding future observational field programs in Antarctica.
1. Introduction: The Silent Sentinel of Sea-Level Rise
The Antarctic Ice Sheet is the heavy-hitter of global sea-level rise, a frozen fortress holding enough water to redraw the world’s coastlines. While news cycles often focus on the dramatic “calving” of city-sized icebergs or surface slush visible from space, the most consequential changes are occurring in the dark. Deep beneath the floating ice shelves that fringe the continent, the ocean is eating away at the ice from below.
This “basal melting” is a critical uncertainty in climate science. When these floating shelves thin, they lose their ability to buttress the massive glaciers behind them, essentially pulling the cork out of a bottle and allowing land-based ice to slide into the sea. Beyond mere sea-level rise, this meltwater acts as a massive freshwater injection that influences the formation of Antarctic Bottom Water (AABW). Because AABW is a primary driver of the “global conveyor belt” of ocean currents, the melting of Antarctica’s underbelly is a global climate event, not just a polar one.
To decode these hidden dynamics, the Realistic Ice Shelf-Ocean Estimates (RISE) Project has synthesized data from nine major international ocean simulations. Rather than prescribing a single experimental design, RISE is a “post-hoc” ensemble—a journalistic-style synthesis of diverse, existing models that reveals how the ocean is reshaping the continent’s foundation.
2. Temperature Isn’t Everything: The Secret Power of Ocean Currents
It is tempting to assume that melting is simply a matter of how warm the water is. However, the RISE data reveals that temperature is only one half of the engine. Melting is actually dictated by a partnership between thermal driving (T∗) and friction velocity (u∗).
Thermal driving represents the degree to which the ocean water exceeds the local freezing point. But for that heat to actually penetrate the ice, it must be delivered by movement. Friction velocity measures the strength and turbulence of the ocean currents at the interface. To use a more domestic analogy: warm water alone is like sitting in a lukewarm bath; moving warm water is like being hit by a power-washer. Even relatively cool water can cause aggressive melting if the currents are fast enough to constantly replenish the heat at the ice’s surface.
Scientists have coined a metric for this relationship: thermo-kinematic melt sensitivity (ζ). For the Multi-model Mean (MMM), this sensitivity is calculated at 4.82×10⁻⁵∘C−1. This ζ value acts as a “speed limit” for ice loss, determining how effectively a shelf responds to the combination of heat and current speed. As the RISE researchers note:
“Because friction velocity is critical for turbulent heat exchange, ice-shelf melting must be characterized by both ocean energetics and thermal forcing.”
3. The “Satellite Gap”: Why Our Models and Our Space Eyes Disagree
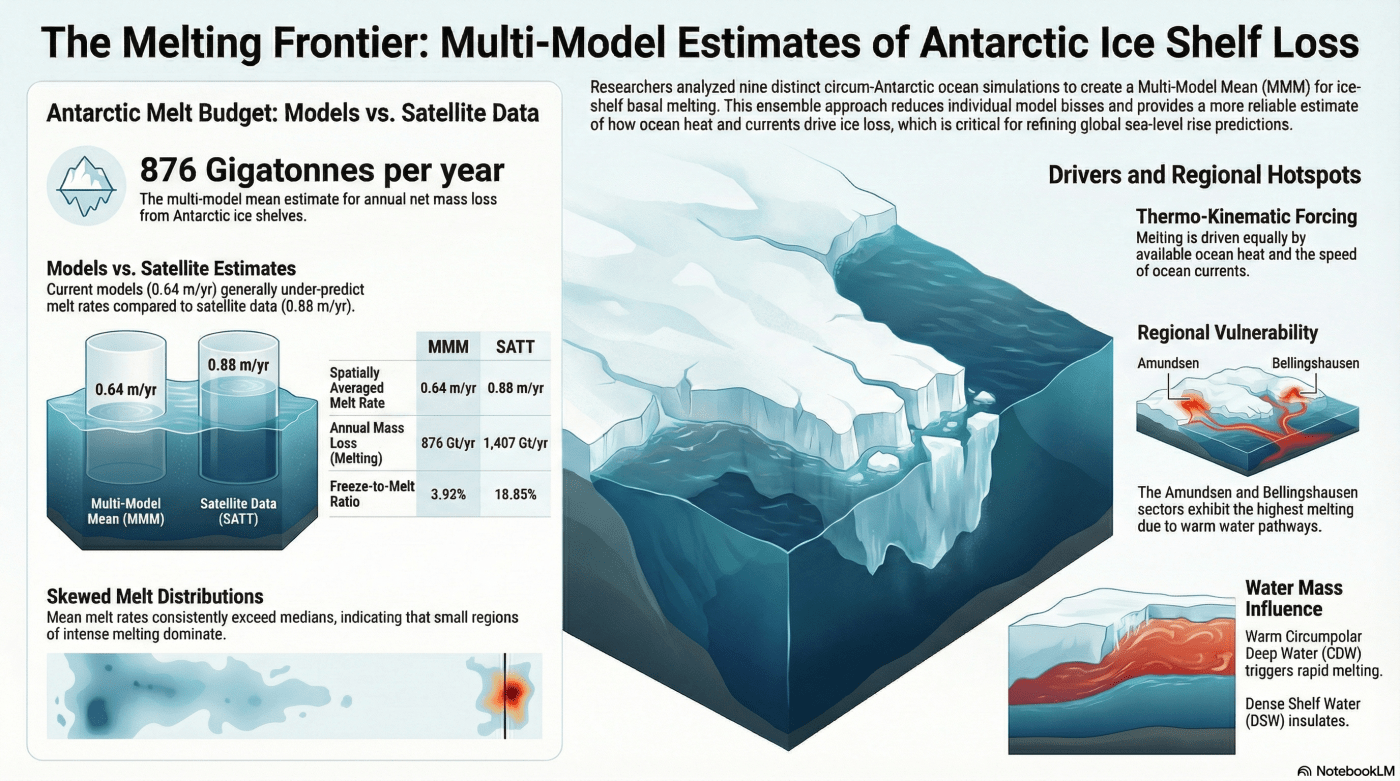
A striking finding of the RISE Project is the persistent “Satellite Gap.” When researchers averaged the nine simulations, they found that numerical models generally estimate lower melt rates (~0.64 m/yr) compared to what satellites perceive (~0.88 m/yr).
This gap highlights the immense difficulty of measuring something through kilometers of ice. Satellites are hindered by orbital geometry and sensor resolution. They also struggle with “grounding-zone flexure”—the vertical movement of ice with the tides—which can trick sensors into interpreting tidal shifts as permanent thinning. Furthermore, satellites must account for the thickness of “firn” (compacted snow), a calculation that introduces its own set of uncertainties.
The data suggests that current satellite products may be overestimating both the rates of melting and the rates of refreezing. This is particularly evident in regions dominated by Circumpolar Deep Water (CDW). This warm, salty water mass often intrudes onto the continental shelf through deep troughs, driving intense melting in high-stakes sectors like the Thwaites Glacier.
Fact Check: The Antarctic Mass Budget Discrepancy
| Source | Annual Melting (Gt/yr) | Annual Refreezing (Gt/yr) | Net Mass Loss (Gt/yr) |
| Multi-model Mean (MMM) | 876 | 33 | 843 |
| Satellite Estimates | 1,407 | 223 | 1,184 |
4. The Mystery of the Growing Ice: The Refreezing Struggle
Antarctica’s underbelly is not purely a site of destruction; it is also a place of growth. This counter-intuitive phenomenon is measured by the “freeze-to-melt ratio.” In cold cavities, Dense Shelf Water (DSW)—which is cold, salty, and produced by sea ice formation—can lead to “frazil accumulation.” Here, tiny ice crystals form within the water column and float upward, sticking to the bottom of the ice shelf like upside-down snow.
The Amery Ice Shelf is the frontline of this research. While known for high levels of refreezing, most models struggle to capture this accurately, often producing warmer conditions that overestimate melt. This represents a significant hurdle: if a model cannot accurately predict where ice grows, it cannot fully predict the stability of the ice sheet. Currently, models show a freeze-to-melt ratio of just 3.92%, while satellite data suggests a much higher 18.85%. This discrepancy between “warm” shelves like Thwaites and “cold” shelves like Amery underscores the regional complexity that global models are still striving to master.
5. Strength in Numbers: Why a “Mean” Model is the Best Tool We Have
No single computer model is perfect. Each simulation uses different mathematical “parameterizations” to handle complex seafloor shapes or small-scale mixing. To overcome these individual biases, the RISE Project relies on the Multi-model Mean (MMM), a strategy grounded in the “Central Limit Theorem.”
Think of this as the “wisdom of the crowd.” Just as averaging the testimonies of nine different witnesses often yields a more accurate account of an event than trusting a single observer, the MMM reduces individual model biases. By combining simulations like COCO, NEMO, and FESOM, researchers can smooth out the “noise” and identify the signal. This ensemble strategy is the project’s most robust tool:
“The ensemble mean thus serves to reduce individual biases and smooth out uncertainties, resulting in a more reliable representation of basal melt.”
6. Conclusion: Navigating an Uncertain Horizon
The interaction between the Antarctic Ice Sheet and the Southern Ocean is a high-stakes tug-of-war involving heat, salt, and movement. Improving these models is not a niche academic pursuit; it is the prerequisite for helping global society adapt to the rising seas of the next century. Every millimeter of accuracy in predicting basal melt translates to better-informed infrastructure and policy decisions on distant shores.
As we refine our “digital brains”—the models—and reconcile them with our “eyes in the sky,” we are beginning to see the true vulnerability of the ice. The question remains: As our models get sharper and our observations get deeper, will we find that the Antarctic underbelly is more resilient than we feared, or are we just beginning to understand the true scale of the change beneath the ice?
The infographic was generated by Notebook LM.
Galton-Fenzi, B. K., Porter-Smith, R., Cook, S., Cougnon, E., Gwyther, D. E., Huneke, W. G. C., Rosevear, M. G., Asay-Davis, X., Boeira Dias, F., Dinniman, M. S., Holland, D., Kusahara, K., Naughten, K. A., Nicholls, K. W., Pelletier, C., Richter, O., Seroussi, H., and Timmermann, R.: Multi-model estimate of Antarctic ice-shelf basal mass budget and ocean drivers, The Cryosphere, 19, 6507–6525. https://doi.org/10.5194/tc-19-6507-2025, 2025

Leave a comment