
This blog post and the “Deep Dive” podcast, created by NotebookLM, are based on “The Scotland-Canada overturning array (SCOTIA): twenty years of meridional overturning in the subpolar North Atlantic” by Fox et al. (2026).
The SCOTIA observing array provides a new 20-year record of the Atlantic meridional overturning circulation (AMOC) at subpolar latitudes from 2004 to 2024. By integrating mooring data, Argo floats, and satellite altimetry, researchers successfully extended subpolar observations to match the timeline of subtropical monitoring systems like RAPID. The findings indicate that while the subtropics show a slight weakening trend, the subpolar AMOC exhibits no statistically significant decline over the same period. Instead, the region is characterized by high interannual variability and decadal fluctuations driven by water mass changes in the Labrador Sea. This dual-latitude perspective helps clarify the complex relationship between ocean heat transport and climate stability across the North Atlantic. This long-term dataset is essential for validating climate simulations and predicting future changes in global ocean circulation.
Introduction: The Ocean’s Unseen Engine
The Atlantic Meridional Overturning Circulation (AMOC) is one of the planet’s most critical climate regulators. Often sensationalized as a great “conveyor belt,” it carries warm water north, shaping weather patterns across the Northern Hemisphere. The potential shutdown of this system is a classic climate tipping point, fueling speculation about a deep freeze scenario.
Scientists expect the AMOC to weaken due to climate change, but proving it is another matter entirely. Directly measuring a subtle slowdown across the vast and turbulent North Atlantic is an immense scientific challenge. How can we detect a long-term trend hidden within the ocean’s powerful natural swings?
Now, a groundbreaking 20-year analysis has given us our first long-term, high-resolution look at the circulation in the critical subpolar region. This new record, called the Scotland-Canada overturning array (SCOTIA), reveals a story that is far more complex and surprising than the simple “slowing down” narrative we thought we knew.
1. The Northern Current is Holding Steady… For Now.
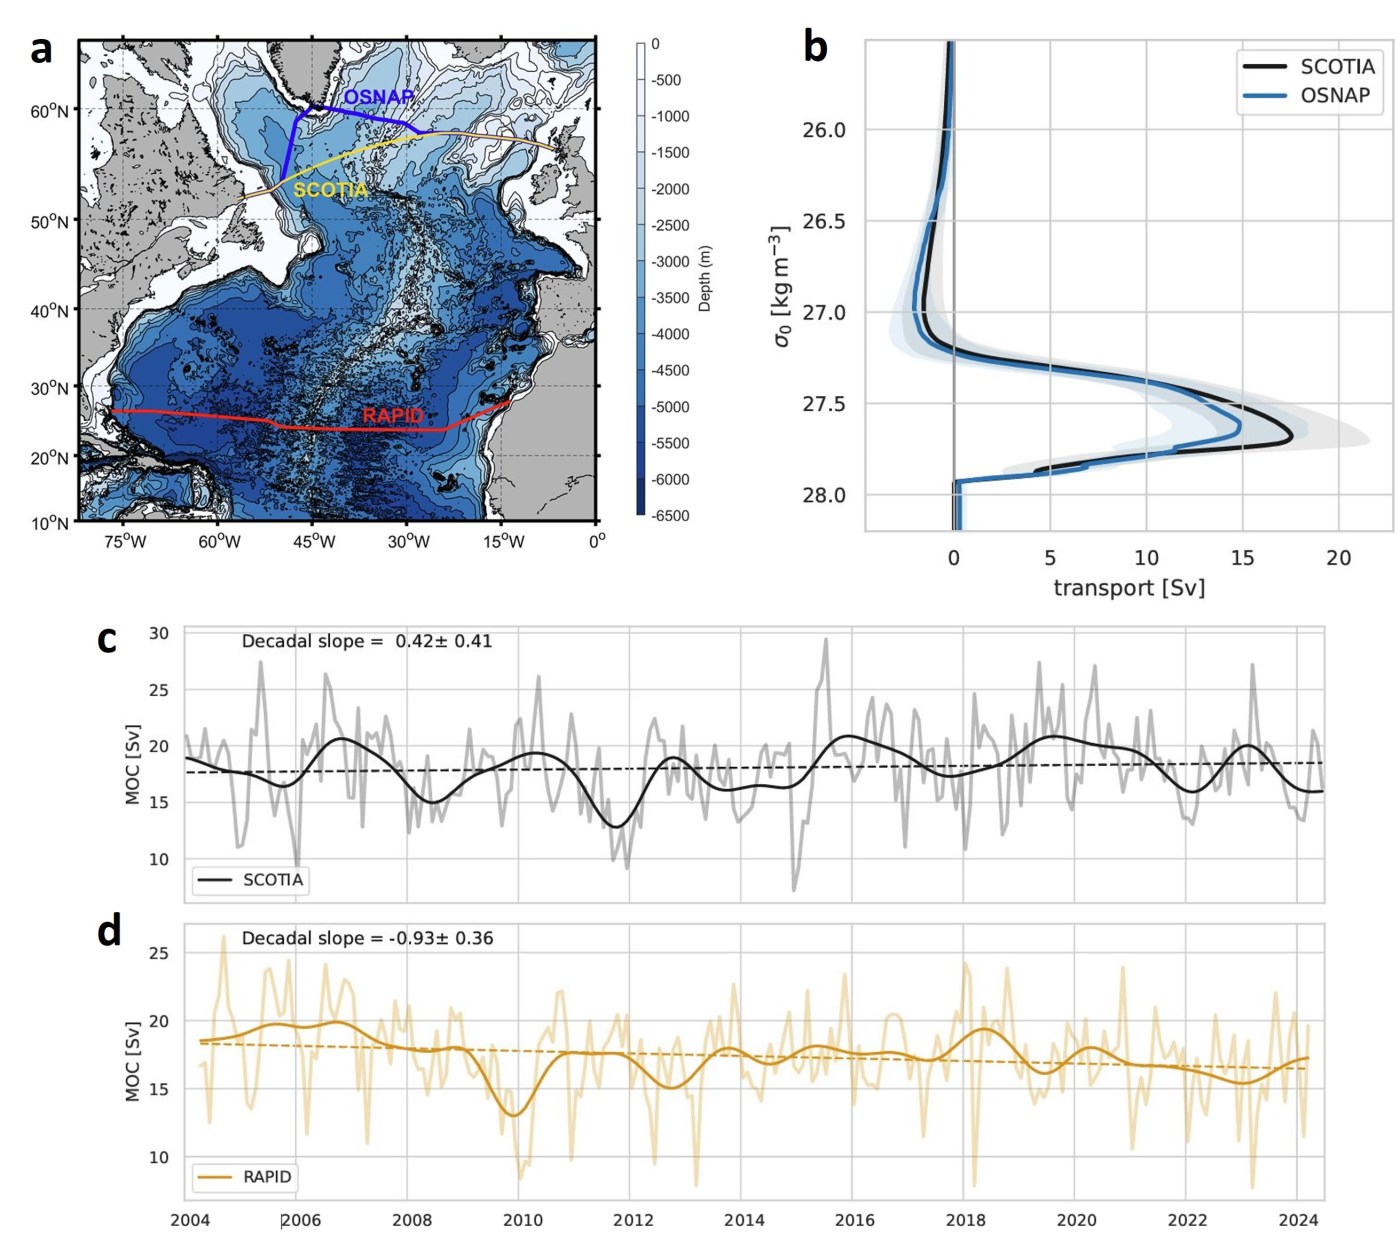
The most counter-intuitive finding from the 20-year SCOTIA record is a striking lack of change. While a separate monitoring array in the subtropics (the RAPID array) is just beginning to show a statistically significant weakening trend, the new data from the subpolar region shows no such decline over the same 2004-2024 period.
This is surprising because it challenges the idea of the AMOC as a single, uniformly weakening system. It suggests that different parts of this massive current system are behaving differently. This doesn’t mean a slowdown isn’t happening in the subpolar North Atlantic—a region known for its massive natural variability. Instead, it means that any long-term, human-caused trend is still too small to be detected above the powerful multi-year cycles that dominate the region. And as the new data reveals, those natural cycles are driven by powerful, periodic events originating in the heart of the subpolar sea.
After 20 years of sustained monitoring in the subtropics, a detectable AMOC weakening trend is now beginning to emerge. However, this new 20-year subpolar record shows no statistically significant trend during the same period from 2004 to 2024.
2. The Labrador Sea’s “Deep Breath” Can Supercharge the System.
The subpolar AMOC is anything but a steady flow. The SCOTIA data reveals it experiences powerful multi-year cycles, including a period of “anomalously high overturning” between 2016 and 2020. This surge wasn’t random; the study links it directly to a specific physical process: an increase in the southward flow of incredibly dense water formed in the Labrador Sea.
You can think of this process as the Labrador Sea taking a “deep breath.” Between 2012 and 2018, intense winter cooling caused surface water to become extremely dense and sink to great depths in a process called deep convection. This formed a class of Labrador Sea Water that was not only anomalously large but also among the densest observed in decades. As this massive volume of dense water subsequently flowed south, it acted like a powerful pump, supercharging the entire overturning circulation. For the first time, scientists have been able to observationally link this specific deep convection mechanism to decadal-scale changes in the AMOC’s strength.
3. A Tale of Two Currents: The Atlantic’s Rhythms Aren’t the Same Everywhere.
By comparing the 20-year SCOTIA (subpolar) and RAPID (subtropical) records side-by-side, a tale of two very different currents emerges.
- Variability: The subpolar current is far more volatile. The SCOTIA data shows significantly stronger seasonal cycles and more pronounced swings on 3-to-5-year timescales compared to its calmer subtropical counterpart.
- Long-Term Trend: The core difference remains the long-term trend. The subtropical current at RAPID shows a slow, marginally significant decline that may be due to a step-change drop around 2009 rather than a steady, linear weakening, while the subpolar current at SCOTIA shows no detectable trend at all.
This discrepancy has a major implication for scientists: monitoring the AMOC at just one latitude isn’t enough to understand the whole system. The different behaviors in the two regions create a critical puzzle scientists must now solve. This discrepancy means that between the subtropics and the subpolar region, the ocean is either storing huge amounts of dense water or mixing heat in ways our models don’t fully capture, a crucial gap in our understanding of how the Atlantic will respond to climate change.
4. We Can Now “Time Travel” to See the Ocean’s Past.
What makes the SCOTIA array so special is not just its findings, but its innovative method. It isn’t a new set of instruments that were deployed continuously for 20 years. Instead, scientists ingeniously combined data from multiple existing sources—stitching together decades of measurements from long-running moorings at the Atlantic’s edges with scattered profiles from ship-based instruments and a modern fleet of robotic Argo floats roaming the ocean’s interior.
This clever “data time travel” provides the first-ever opportunity to directly compare the subpolar and subtropical AMOC over the same two-decade period, revealing the crucial differences in their behavior. Looking forward, the study proposes that this method offers a blueprint for a more lightweight, reliable, and sustainable way to monitor this vital climate system. The technique is so effective that it could even pave the way for a high-fidelity “AMOC live stream,” allowing for near-real-time updates on the health of the Atlantic’s circulation.
Conclusion: A More Complex, More Fascinating Picture
The story of the Atlantic’s great overturning circulation is not one of simple, one-way decline. This new 20-year view reveals a far more fascinating and complex picture—a dynamic interplay between powerful natural cycles, distinct regional behaviors, and a subtle underlying long-term trend that appears differently depending on where you look. The SCOTIA record provides a much-needed, sharper view of this engine of global climate.
With this new, more nuanced understanding, the question is no longer just if the AMOC is changing, but how, where, and why—and what other surprises does the deep ocean still hold for us?
Figure derived from Figures 1, 3, and 5 in Fox et al. (2026): (a) Bathymetric map of the North Atlantic showing the locations of the RAPID (2004-present), OSNAP (2014-present), and SCOTIA (2004-present) sections. (b) Mean overturning streamfunctions [Sv] in density space for SCOTIA (black line) and OSNAP (blue line). Shaded areas show the standard deviation of the streamfunction. The means have been calculated for the period spanned by the available OSNAP data (2014 to 2022). (c-d) Timeseries of overturning and transports from (c) SCOTIA and (d) RAPID for the 20year period 2004 to 2024). Black lines– SCOTIA, amber lines– RAPID. In each case the paler solid lines are the monthly values, darker solid lines the 18month low-pass filtered timeseries, and the dashed lines show the trend. The trend and the 95% confidence limits on the trend are given in each panel.
Fox, A. D., Fraser, N. J., Burmeister, K., Jones, S. C., Cunningham, S. A., Drysdale, L. A., Dilmahamod, A. F., and Karstensen, J. (2026). The Scotland-Canada overturning array (SCOTIA): twenty years of meridional overturning in the subpolar North Atlantic, EGUsphere [preprint], https://doi.org/10.5194/egusphere-2025-6176.

Leave a comment