
This blog post and the “Deep Dive” podcast, created by NotebookLM, are based on a preprint article “Tropical cyclone-driven storm surge and wave database for the US North Atlantic and Gulf coastlines” by Deb et al. (2026).
This publicly available database provides a comprehensive hindcast of storm surge and wave conditions for 232 impactful tropical cyclones that struck the U.S. North Atlantic and Gulf coastlines between 1981 and 2021. Researchers utilized the coupled ADCIRC+SWAN modeling system on a high-resolution unstructured mesh to generate hourly data on water-surface elevation, wave height, and peak wave period. The study validated these simulations against NOAA tide gauges and NDBC buoys, finding strong accuracy in water level predictions despite some systematic biases in wave metrics. This extensive resource is designed to support coastal flood hazard assessments, the training of machine learning models, and the development of local resilience planning. By filling critical gaps in historical observational data, the database enables a more detailed understanding of extreme-value trends across four decades of storm activity. The authors provide the records in compressed NetCDF format alongside specialized Python scripts to facilitate easy data extraction and visualization for the scientific community.
A New 40-Year Archive to Revolutionize Coastal Resilience
The $1 Trillion Problem
The United States coastline is facing a period of unprecedented vulnerability. Currently, nearly $1 trillion of property and more than 40% of the U.S. population are concentrated in coastal counties, leaving millions of people and critical infrastructure directly in the path of increasingly volatile tropical cyclones.
Protecting these regions requires more than just physical infrastructure; it requires a deep, high-fidelity understanding of historical risks. However, a significant “data gap” has long hindered our planning. Our primary field observations come from NOAA tide gauges and wave buoys, which are spatially sparse and prone to failure during the exact extreme conditions we need to measure. To bridge this gap, researchers have produced a massive new hindcast database. By simulating 232 impactful storms over a 40-year period, this archive provides the consistent, high-resolution history required to build a resilient future.
The Power of 232: A Massive Historical Archive
This new database spans four decades, from 1981 to 2021, capturing the precise dynamics of every significant tropical cyclone to strike the U.S. North Atlantic and Gulf coasts.
The year 1981 serves as the starting point for a critical scientific reason: the availability of “structural DNA.” Storm records prior to 1981 often lacked the radius of maximum winds (Rmax), a parameter essential for reconstructing accurate wind fields. By focusing on the post-1981 era, researchers utilized the highest-quality National Hurricane Center (NHC) best-track data to ensure the modeled surges reflected reality.
The economic necessity for such a granular archive is underscored by the staggering costs of recent history:
“Recent major hurricanes Harvey (2017), Michael (2018), and Ian (2022), caused an estimated $155.0B, $25.5B, and $116.3B worth of total damage, respectively.”
High-Definition Coastlines: The 100m Resolution Feat
Traditionally, basin-scale models lack the resolution to inform local urban planning. This database shatters that limitation by employing a “coastal-refined unstructured mesh.” While standard models view the ocean in broad strokes, this flexible grid tightens its focus to a resolution of approximately 100 to 500 meters in critical nearshore regions, such as the Mid-Atlantic, West Florida, and the Texas coast.
This technical achievement is powered by the coupled ADCIRC+SWAN system, where water level and wave models “talk” to each other every 20 minutes to capture complex surge interactions. To maintain model stability and scientific precision at this scale, the simulation utilizes a 4-second time step and a 0.1m wetting depth. This ensures the physics remain consistent even as water pushes into complex coastal geometries.
Fueling the Next Generation of AI Predictors
The precision of the 100m mesh does more than just reconstruct history; it provides the high-fidelity “ground truth” necessary to train the technology of the future. This archive acts as a standardized training ground for Artificial Intelligence and Machine Learning (AI/ML) models.
By providing consistent, physics-based hindcasts across 232 storms, the dataset allows AI developers to create “surrogate models.” These tools can eventually predict coastal flooding in seconds rather than the hours required by supercomputers. For urban planners, this is a game-changer: it allows for “apples-to-apples” comparisons between different machine learning architectures, ensuring that municipal flood tools are built on a bedrock of consistent physics. As the source emphasizes:
“This dataset fills a critical need for… training and benchmarking of machine-learning-based surge and wave models.”
The “Honest” Science: Where the Model Hits a Wall
In the spirit of scientific transparency, the researchers validated their simulations against 23 NOAA tide gauges and 23 NDBC buoys. While the model shows high skill in predicting water levels, it is remarkably honest about its limitations—particularly a systematic overprediction of wave height in deep offshore waters.
This wave bias is attributed to several complex factors, including the limitations of the 2D barotropic formulation in capturing features like the Loop Current, as well as challenges in wind drag parameterization and whitecapping dissipation formulations. Engineers using this data must also account for a vertical datum offset; while the model is referenced to “Model Zero,” it may differ from local mean sea level by a range of 0 to 0.4 meters.
| Metric | Water Level (Surge) | Peak Wave Period |
| Performance Level | High Skill | Challenging / Poor |
| Correlation (R) | 0.86 (Mean) | 0.24 to 0.91 (High Variability) |
| Systematic Bias | 0 to 0.4m (Datum Offset) | Systematic Overprediction |
| Key Characteristic | Robust for coastal planning | Significant regional variation |
The Supercomputing Engine Under the Hood
Creating this 40-year digital archive required the computational “muscle” of the Perlmutter supercomputer at the National Energy Research Scientific Computing Center (NERSC).
The efficiency of this system is staggering. Each 6-day storm simulation was completed in approximately one hour of wall-clock time—a throughput of 6 model days per wall-hour. However, because each simulation utilized 128 cores simultaneously, every single storm represents 128 core-hours of computational effort. Scaled across 232 storms, this represents a massive public investment in coastal intelligence.
The Future of Coastal Resilience
This 40-year database stands as a comprehensive basin-scale resource for the next generation of urban planners, engineers, and tech enthusiasts. By providing high-resolution data in regions where field observations are sparse, it enables more accurate infrastructure vulnerability studies and smarter resilience planning.
As we look toward the next 40 years of coastal development, we must ask: How will these data-driven insights change the way we design our cities and protect our most vulnerable communities? The data is now available.
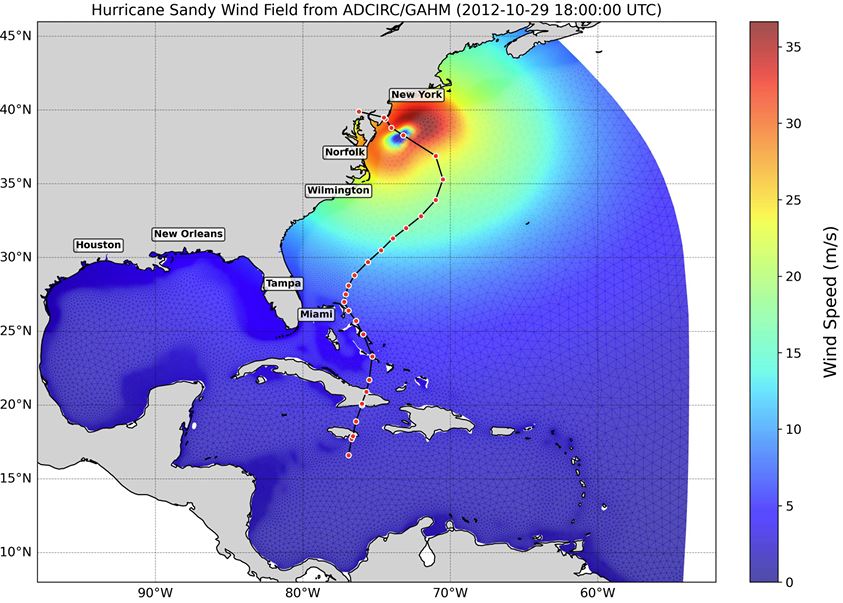
Figure 5 from Deb et al. (2026): The instantaneous wind field generated by GAHM on the ADCIRC model grid shows the landfalling wind speed of Hurricane Sandy (2012) along with the hurricane track. The black line represents the track, and the red circles are storm positions at every six-hour intervals.
Mithun Deb, Karthik Balaguru, Julian Rice et al. Tropical cyclone-driven storm surge and wave database for the US North Atlantic and Gulf coastlines, 06 February 2026, PREPRINT (Version 1) available at Research Square [https://doi.org/10.21203/rs.3.rs-8555675/v1]

Leave a comment